What Parcl Traders Need to Know
- Residential real estate prices (median ppsft) in the fifteen tradable Parcl markets continue to rise MTD in May at +1.0%. This follows +1.8% in April.
- Some markets - such as New York, Philadelphia, Denver, and Chicago - have risen at a more significant pace.
- April winners have been the biggest losers in May: Los Angeles (-2.9% MTD, up 5.5% in April), Brooklyn (-1.9% MTD, +4.5% in April) and Miami Beach (-1.3% MTD, +9.4% in April) all lag.
- Parcl traders continue to generally skew long, but are riding momentum on both the long & short side. Notably, two of the three markets that skew short were the largest winners in April: Los Angeles (80% short) and Brooklyn (55% short).
- Interestingly, Miami Beach, the largest winner YTD, is as short as it has been since the pool launched at 51%/49% long/short.
The state of real time real estate prices
Residential real estate prices have broadly risen month to date (MTD) in May, with the 15 tradable Parcl markets covered in this update now up 1.0% MTD, on average. This compares to +1.8% in April.
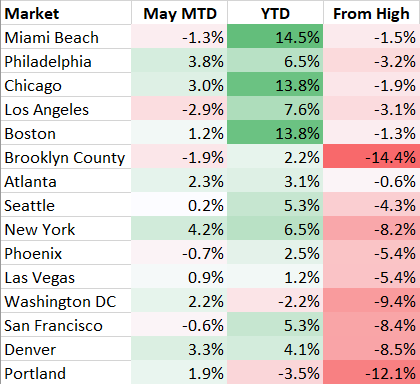
Some markets - such as New York (+4.2% MTD, +6.5% YTD, down 8.2% from peak), Philadelphia (+3.8%, +6.5%, -3.2%), and Denver (+3.3%, +4.1%, -8.5%) - have risen at a more significant pace. Laggards are April winners Los Angeles (-2.9%, +7.6%, -3.1%), Brooklyn (-1.9%, +2.2%, -14.4%), and Miami Beach (-1.3%, +14.5%, -1.5%); all are down MTD.
Much of May performance MTD is both a mean reversion and leadership transfer across different markets, and is a continuation of the trend of regional divergence that has persisted for much of the past ~12 months, at all levels of geography (national regions, state vs. state, intra-metro, etc.)

Atlanta is approaching all time high in median price per square foot this update. Boston, Miami Beach, and Chicago, the three top performing Parcl markets YTD, are all within 2% of all time highs.
Miami Beach and Boston continue to screen as top performers on a risk-adjusted basis. Portland and Denver screen as the worst performers.

What factors are driving markets generally?
Volatility across markets remains relatively subdued, though up slightly week over week, after a spike in March around bank solvency concerns as evidenced by the VIX Index and St. Louis Fed Financial Stress Index (shown below). This has led to a stabilization in risk appetite, though both treasury yields and equity markets remain approximately flat over the trailing 30 days.

may.png)
On the other hand treasury yields continue to exhibit elevated realized volatility, which has an impact on myriad downstream elements, such as mortgage rates and demand for housing. Phoenix and Las Vegas are two regional US real estate markets that exhibit among the highest negative correlations to real time changes in interest rates.

The spread between 30 year mortgage rates and the 10 year U.S. Treasury yield remains historically wide. Should this spread mean revert somewhat, and the 10y Treasury remains unchanged or continues to decline, this could perhaps create an additional tailwind for residential real estate demand near term. Important to note, the magnitude is diminished when adjusting for the effects of duration relative to the treasury yield curve.
.png)
The Case Shiller will update with March data next week, which is expected to show a continued recovery from January lows. Real time data from Parcl Labs picked this up as it was happening, and, in the nearly two months since, shows a strong recovery, with many markets up low/mid single digit percent from their end-March marks.
What are Parcl traders doing?
Parcl traders continue to generally skew long and ride momentum. Notably, two of the three markets that skew short were the largest winners in April: Los Angeles (80% short) and Brooklyn (55% short). San Francisco (flat in April, up 5.3% YTD) rounds out the short skewed markets at 55%.
Interestingly, Miami Beach, the largest winner YTD, is as short as it has been since the pool launched at 51%/49% long/short.
Assuming financial conditions remain relatively accommodative, we should expect to see a continued bullish tilt across Parcl markets, though this may continue to offer opportunities for traders to open contrarian positions, especially in regional markets with weaker relative fundamental trends. This could be particularly attractive to traders that have a contrarian or market neutral view on Parcl markets with funding rate arbitrage opportunities.