.png)
Executive Summary
- Parcl’s data mission is to create the global standard for residential real estate pricing and analytics; first & foremost through the Parcl Price Feed (PPF) and the Parcl Protocol.
- Existing residential real estate data is imperfect: fragmented, de-centrally centralized, lacks uniformity, and there is little commercial incentive to establish a single source of truth.
- The U.S. residential real estate benchmark is past its prime, if it ever had one: the Case-Shiller Index is a lagged indicator (2+ month lag), represents just a portion of the true ‘market’ (new construction is excluded, houses that are substantially renovated before being sold, as are condominiums, co-ops, and perhaps townhomes), and is methodologically opaque (three-month moving average that multiple reputable third parties have had difficulties replicating even with identical data). Furthermore, the Case-Shiller Index depends heavily on county records, which can take months to record sales (the actual latency differs by county). There are over 3,000 counties in the United States.
- Parcl is making several, substantial improvements: leveraging state of the art data engineering and data science best practices to ensure the best quality of data. Accounting for new construction, renovated houses, units that have only been sold once, & multi-family residences. Introducing an ensemble approach; the PPF is composed of multiple models considered best in class, and brought together to provide the most accurate price signals at the neighborhood level. Parcl Labs is doing all of this - and more - in real-time.
- Price Feeds are Not Price Indices: Case-Shiller indices only capture single-family housing stock that has been sold at least once before. Dilution has a real, tangible effect on supply and demand. More supply has an impact on price (such as share issuance in equities, treasury dilution in crypto). Via the PPF, we are fundamentally evaluating supply and demand in real time at very specific levels of geography previously inaccessible for analysis.
- A new Single Source of Truth is coming soon: Parcl Price Feeds and the Parcl Protocol will provide real-time, representative, and comprehensive residential real estate pricing and enable a liquid market for real estate exposure, for the first time, ever.
Parcl’s Data Mission
Create the global standard for residential real estate data
At Parcl, via our Parcl Labs effort, we are pushing forward at warp speed to create a single source of truth for residential real estate data around the world. Parcl is focused on residential real estate data because it is where we see the most significant opportunity to make an impact, both through real-time market pricing via the Parcl protocol and through modernized data ingestion, warehousing, and analytics.
For several reasons we will outline below, this is no easy challenge. Currently, residential real estate data is fragmented, decentrally centralized, lacks uniformity, and there is little commercial incentive to establish a single source of truth.
Parcl is addressing each of these issues head-on. The result is a price feed at the neighborhood level (Parcl Price Feeds) that better reflects market conditions. In time we will set the standard for residential real estate data and analysis.
The State of Residential Real Estate Data
Despite being the largest asset class in the world, where numerous interrelated factors drive value, real estate has consistently trailed most industries in terms of data maturity. A lack of tech-enabled transparency has primarily been the product of intermediaries; agents, brokers, and other value-added services which have historically viewed asymmetric and proprietary information as a sellable service. Real estate in a sense is the ultimate local sector, and as such it has failed to innovate at the same pace of other tech intensive tradable sectors. Any efforts to change this in a scalable way have been further obstructed by a lack of data uniformity stemming from the heterogeneous and illiquid nature of real estate assets.
The data obscurity found in real estate is not only a North American phenomenon, but rather a global one with unique challenges in each market. As such, we at Parcl continue to iterate on our R&D process to find the best way to present accurate, timely data at multiple geographical levels, across the globe. In short - we recognize that the paramount challenge is to create an accurate & representative price feed that is globally scalable. We look forward to taking these challenges head on as we expand into cities in Europe and Asia later this year.
More recently, real estate data tech has begun to modernize, with many platforms attempting to provide insight for various use cases across verticals. However, the industry is still mainly informed by an assortment of unstructured and non-standardized raw data. With these disparate datasets as the baseline, even the most sophisticated data aggregators improvise to fill in the gaps.
There is no real commercial incentive to establish a definitive source of truth for residential real estate data.

Existing Residential Real Estate Data Sources are Highly Fragmented
MLS Networks
Prior to public listings being aggregated on the internet, shared books of consolidated listing data known as Multiple Listing Services (MLS) offered a way for intermediaries to exchange and leverage geographically organized property information. Even today, digitized MLS networks are still widely considered to be the gold standard of real estate data, as proponents claim that regulation and required manual inputs provide the standardized and reliable data that drives a competitive market.
In the United States alone there are approximately 600 different MLSs (~40 in Canada), each dictating their own data standard with unique fields, ranges, and values. Accounting for inconsistencies and duplicate listings across multiple networks is necessary to achieve any sort of valuable integration.
Similar challenges arise when attempting to aggregate data from public records (such as county registrars or tax records). Data collection methods, publication methods, and regulations vary considerably county to county. The result is heterogeneous data prone to incomplete or missing entries and reporting latency issues; in some counties it can be 6 months before a real estate transaction is actually reported.
Benchmarking: Current standards are highly outdated and don’t capture over 40% of data
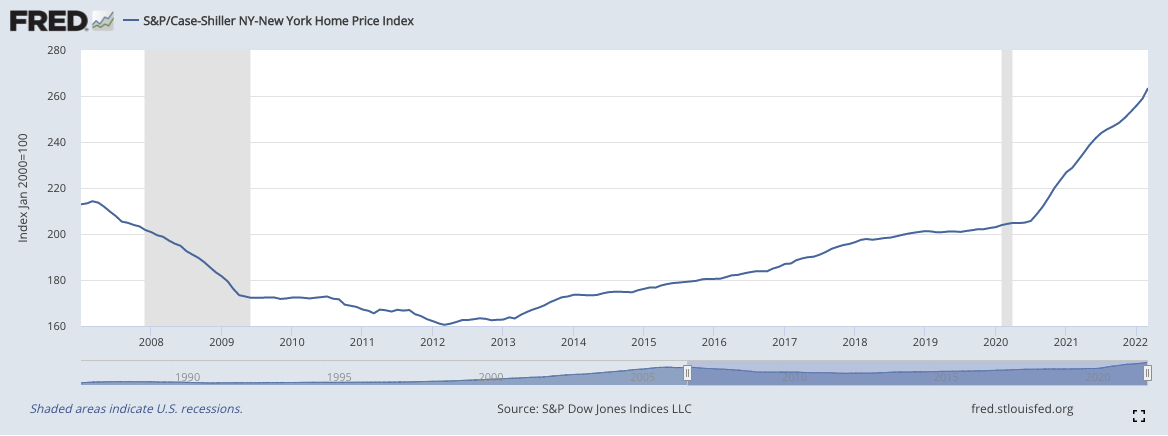
The most prominent and widely cited independent resource that the U.S. residential real estate market currently has for a normalized benchmark (regional and national) is a composition of several price indices known as the S&P CoreLogic Case-Shiller Index.
The Case-Shiller indices measure monthly real estate price changes, calculated from data on repeat sales of single-family homes across 20 major U.S. metro areas and nationally. This approach was initially developed by economists Allan Weiss, Karl Case, and Robert Shiller, who later sold the Index to CoreLogic in 2013.
The Case-Shiller index was developed in the 1980’s. At the time it was a major innovation in how one could reliably track changes in single-family home prices. Reflecting back on the times, Apple released the first Macintosh in 1984 with a processor running at 8.00MHz, capable of roughly 1.4 million instructions per second (MIPS), connected to 128 KB of RAM and 400 KB of storage. The portable laptops we use today at Parcl run at 3.5Ghz, are capable of over 11 trillion operations per second (TIPS), have 500,000x the amount of RAM and ~8 million times the amount of storage. Even still, we favor the cloud where the numbers get a bit extreme for a blog post. Point being, a lot has changed since the 1980’s, an era when data was transferred physically.
Despite its age, we believe that the Case-Shiller’s staying power is primarily a result of the index’s ability to shed light on high-level market trends. The Case-Shiller’s national repeat-sales (existing homes) methodology, which compares arms-length sale prices of the same properties over time, is considered the most academically accurate and representative view into the state of the U.S. housing market.
We believe that this methodology is far from perfect, and in fact may be getting less representative over time. The Case Shiller’s insight into market conditions is backward-looking, as the index reports updates on a two month lag (Case-Shiller updates in late May will relate to sales captured in March). Also, the inputs are only a small representation of the residential market; new construction is excluded, as are condominiums, co-ops and conflicting methodological information regarding whether townhomes are included.
Moreover, the Case-Shiller represents Metropolitan Statistical Areas. The NY MSA as defined by the US Census for the year 2021 is represented below:

Zooming in on the 5 boroughs that are typically considered when one thinks about NYC, we can see it makes up a significantly smaller percentage of the total surface area:

As a matter of fact, the MSA surface area is 31x the size of the 5 boroughs (~297 square miles for the 5 boroughs relative to ~9200 square miles for the MSA). According to 2020 Census population numbers, the 5 boroughs account for approximately 43% the population of the NY MSA, yet based on the definition of the Case Shiller methodology, 71% of sales transactions since 2007 are not represented at all. As we will illustrate, an MSA is not representative of real estate supply/demand issues, but rather an artificial construct that models commuting patterns across cities and counties. People do not move to an MSA, they move to a neighborhood.
Lastly, Case-Shiller Indices are calculated monthly using a somewhat opaque three-month moving average methodology. Third party observers have noted that the information disclosed in Case-Shiller white papers is insufficient to reproduce published results, even with identical data inputs. We at Parcl have encountered similar challenges.
Making the Point: Case-Shiller MSA Case Study
To crystalize the point of what happens when you track a large swath of land and put faith in a measure that is meant to represent the typical transaction in the area, we analyzed over 12.5 million sales transactions since 2007 to understand. Based on how the Case Shiller methodology is articulated, we isolated repeated sales transactions within single family homes against single sales, condos, townhomes, and co-ops to define what is being tracked vs. untracked.
Clicking down into NY, on the surface things seem to look ok for the NY MSA (NYXRSA) with ~66% of sales transactions being covered by the NYXRSA based on our analysis. However, when taking a second look at neighborhoods with the highest transaction volume in the New York Metro area, we see that under the Case Shiller definition 7 out of the 10 have spotty coverage at best. In other words what happens in these neighborhoods is not factored into the New York Case Shiller methodology. Some of the most iconic neighborhoods in Manhattan are basically not included in the CS price index for the region. When we take a look at the top 10 neighborhoods covered by NYXRSA based on sales transaction volume and sort on coverage, we see a very different story:

Most of the top neighborhoods in the NYXRSA have more transactions not covered than covered, with 5 neighborhoods having less than 5% of sales transactions covered. Just these neighborhoods account for more than 50,000 individual sales transactions since 2007.
Unpacking this further, we see that the distribution of tracked vs. untracked transactions varies dramatically over time.

Breaking down the structure of returns for homes annotated as tracked vs. untracked, we also see that the return distribution differs, most notably during and after the COVID Recession.

One might argue that just because these neighborhoods aren’t accurately tracked, their underlying prices follow a similar pattern. Looking at Williamsburg alone, an iconic neighborhood in Brooklyn and flagged as the neighborhood with the most transactions in the NY MSA, we see the divergence can become dramatic:

Comparing this to the index of transactions for the NYXRSA:
We see fundamentally different stories. Williamsburg has experienced dramatic price appreciation since 2007, with over 100% returns if one invested in a typical property in Williamsburg in 2007 and held it through to today. The NYXRSA hardly appreciated 20% during the same period. This highlights what can be lost in translation when we group real estate transactions into large geographical units and use a very restrictive sample definition.
Stepping outside of NY for a moment, let's take a look at the Miami Metropolitan Statistical Area:

And Washington, DC:

In both metropolitan statistical areas, more sales transactions occur outside the purview of the Case Shiller than within it. There are more transactions occurring for these two MSA’s than are represented in the following:
- S&P/Case-Shiller FL-Miami Home Price Index (MIXRNSA)
- S&P/Case-Shiller DC-Washington Home Price Index (WDXRSA)
- S&P/Case-Shiller 10-City Composite Home Price Index (SPCS10RSA)
- S&P/Case-Shiller 20-City Composite Home Price Index (SPCS20RSA)
Based on our analysis, over the last year of sales transactions, CS-10 has lost sight of 42% of real estate sales transactions when accounting for all 10 MSA’s that it is composed of, which as we have seen are not uniformly distributed across MSA’s.

To illustrate the importance of getting a home price feed right, a quick search on regulations.gov finds references to the Case-Shiller HPI in dozens of documents related to policy in the U.S. In our view, an index that leaves out as much as ~42% of transactions, and leaves out more transactions than it covers in two major metropolitan statistical areas, should not determine policy decisions that impact the most important wealth generating asset for households.
The Current “Best” is Not Good Enough
It is clear to us at Parcl that residential real estate is in need of a source of representative, timely and normalized pricing data. A reliable, single source of truth would not only help lenders, investors and intermediaries gain market exposure, uncover unique insights and mitigate risk, but it could also supplement the efforts of RESO and platform-based vendors to bring residential real estate into the modern age of the global data economy. The integration of this data could also prove invaluable for government and research agencies implementing agendas based on geographically specific trends.
There is a significant opportunity to step in and provide the infrastructure for a single source of truth in residential real estate data. Parcl’s data schema and methodology is ideally positioned to address and capitalize on long-standing industry pain points to help usher in a new era of efficiency and transparency. In subsequent posts we will outline our price feed methodology in detail and demonstrate how we are able to take disparate sources of information and provide unique insights at any level of geography available.
How Parcl Sets the Global Standard for Residential Real Estate Data
Parcl takes a unique approach to deliver the most up-to-date price estimate of real estate at any geographical level, e.g., cities, counties, metros, etc. However, when most people think about real estate, they think about neighborhoods rather than an abstract geographic category. With this in mind, we decided to launch with neighborhood-level price feeds and integrate these with the Parcl Protocol to provide users around the world with low-barrier access to liquid real estate exposure.
While we are launching our initial price feeds & Parcl markets with U.S. neighborhoods, we plan to bring Parcl’s unique cutting-edge approach to your neighborhood, anywhere in the world. We are working to create a best-in-class global dataset of residential real estate to uncover market trends and facilitate access to real estate assets globally.
At Parcl, we believe that everyone deserves to participate in the largest asset class in the world, which is also the most consistent asset class for wealth accumulation, and we are working day and night to integrate the Parcl Protocol and the Parcl Price Feed to make real estate more accessible, for everyone.
Stay tuned for more information from Parcl Labs in the coming weeks.
Interested in Parcl Labs and our data initiatives? Visit us at Parcl Labs to learn more.
Interested in learning more about the Parcl Protocol? Visit us at parcl.co, follow us on twitter, and join our discord.
Written by:
Jason Lewris, Chief Data Officer
Kellan Grenier, COO
Jesus Leal Trujillo, Principal Data Scientist
Disclaimer: The material contained on this website is provided for educational and informational purposes only, without any express or implied warranty of any kind. Nothing on this website constitutes or forms a part of any offer for sale or subscription of, or any invitation to offer to buy or subscribe for, any securities, nor should it or any part of it form the basis of, or be relied upon in any connection with any contract or commitment whatsoever. The material is not to be construed as an offer or a recommendation to buy or sell a security nor is it intended to be used for marketing purposes to any existing or prospective investor in any jurisdiction, and is subject to correction, completion, and amendment without notice. The information on this website does not constitute the provision of investment, tax, legal or other professional advice. No reliance may be placed for any purpose on the information and opinions contained herein or their accuracy or completeness, and nothing contained herein may be relied upon in making any investment decision.
Shared content and posted charts are intended to be used for informational and educational purposes only. Parcl does not offer, and this information shall not be understood or construed as, financial advice or investment recommendations. The information provided is not a substitute for advice from an investment professional. Parcl does not accept liability for any financial loss or damages. For more information please see the terms of use.
