What Parcl Traders Need to Know
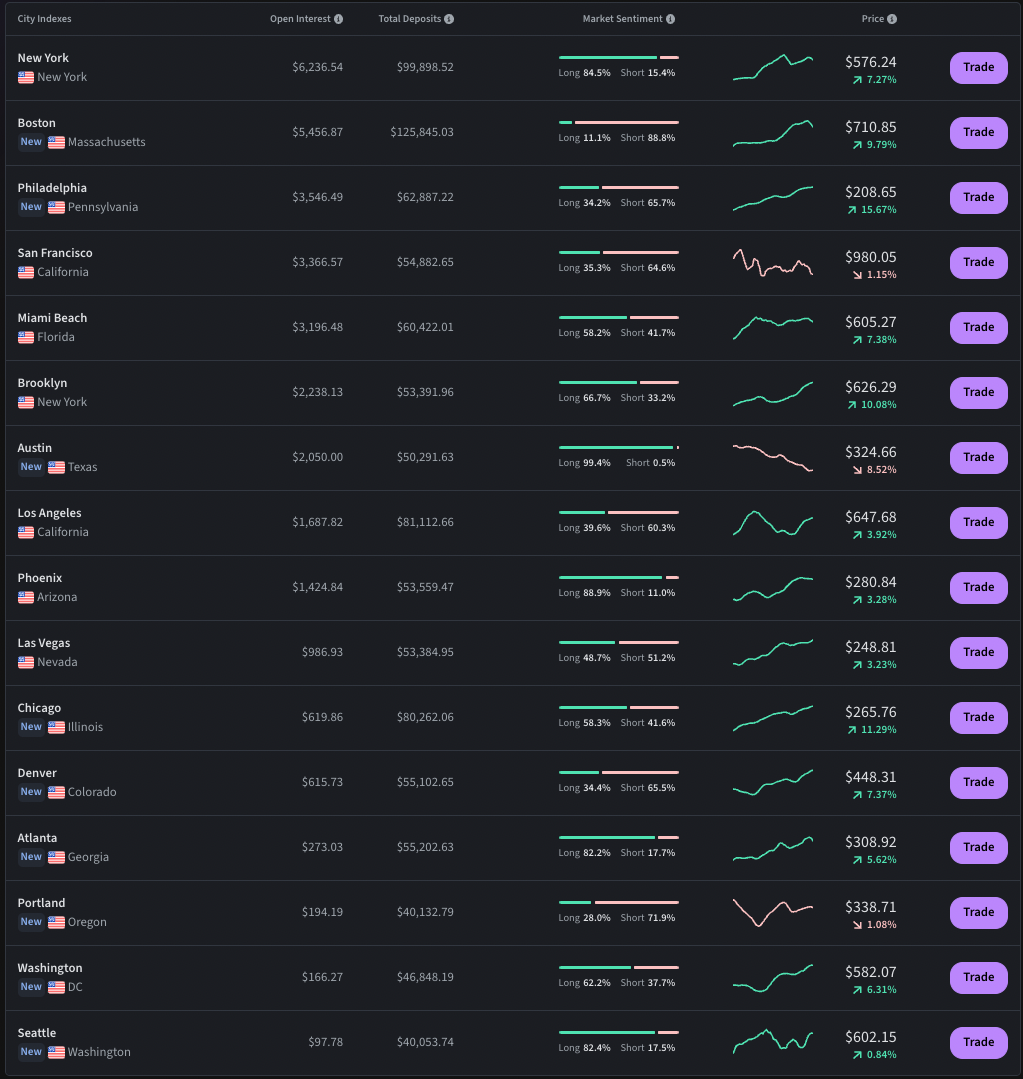
- The fifteen tradable (ex-Austin) Parcl markets finished strong in June with a 2.2% MTD rise in residential real estate prices (ppsft), compared to May's 2.2% and April's 2.0% gains.
- Standouts Brooklyn, Philadelphia, Boston, and Chicago set the pace with significant MTD and YTD rises, with Philadelphia and Chicago both hitting an all-time high exiting June.
- Meanwhile, New York, Portland, and San Francisco all finished June with negative MoM performance. The dichotomy between New York (MoM decline) and its Brooklyn borough (top performer in June) is striking.
- Traders remain fairly balanced, though bearish skews are reemerging, notably in recent leaders Boston, Philadelphia, and Denver. Meanwhile, recent under-performer New York skews meaningfully long.
- Total open interest across all Parcl pools exceeded $90,000 in USDC terms in June; highest OI markets as of July 3rd are New York, Boston, and Philadelphia.
- Austin, Texas recently made its debut as the newest tradable city on Parcl. Stay tuned for more cities coming soon! 🇺🇸 + 🇫🇷
The state of real time real estate prices
Final June data shows that some residential real estate markets experienced meaningful price increases MoM, while others saw a decline. This is a continuation of the trend of regional divergence that has persisted for much of the past ~12 months, at all levels of geography (national regions, state vs. state, intra-metro, etc.) The average May increase across the 15 Parcl markets tracked in this update was +2.2%, which followed average gains of +2.2% in May.
Some markets - such as Brooklyn (+7.0% in June, +10.4% YTD, -7.5% from highs), Philadelphia (+6.2%, +13.4%, all time high), and Boston (+5.6%, +24.2%, -1.2%), - rose at a more significant pace. Laggards in June were New York (-1.1%, +8.6%, -6.4%), Portland (-0.6%, -2.7%, -11.4%), and San Francisco (-0.1%, +5.0%, -8.7%); all were down MoM in June.
The dichotomy between New York (down 1.1% in June) and its borough of Brooklyn (top performer in June +7.0%) stands out. Brooklyn was a YTD laggard - the largest decliner from its all time high - as of the end-May update.

Philadelphia remained at all time highs in this update, while Chicago reached a new all time high. Atlanta is within 1ppt of all time highs. Boston came off its all time high modestly. Miami Beach is 1.2% off its all time high, which it reached within the last 60 days.

Miami and Boston continue to screen as top performers on a risk-adjusted basis. Portland, Seattle, Las Vegas, and San Francisco screen as the worst risk adjusted performers. Denver has emerged out of the bottom quintile and is now around the median.

What factors are driving markets generally?
Volatility across markets remains subdued, with the VIX Index reaching three year lows exiting May. It remained at these levels throughout June. Volatility is well below the spike in March around bank solvency concerns, consistent with real time readings from the St. Louis Fed Financial Stress Index (below). This drop in volatility has coincided with an apparent stabilization in risk appetite; treasury yields remain roughly flat from mid-march, while equity markets are now up double digits.

.png)
On the other hand treasury yields continue to exhibit elevated realized volatility, which has an impact on myriad downstream elements, such as mortgage rates and demand for housing. Phoenix and Las Vegas are two regional US real estate markets that exhibit among the highest negative correlations to real time changes in interest rates.

The spread between 30 year mortgage rates and the 10 year U.S. Treasury yield is the widest it has been in nearly 40 years. Should this spread mean revert somewhat, and the 10y Treasury remains unchanged or continues to decline, this could perhaps create an additional tailwind for residential real estate demand near term. Important to note, the magnitude is diminished when adjusting for the effects of duration relative to the treasury yield curve.
.png)
The Case Shiller updated with May data on Tuesday 6/27, showing a continued recovery in prices across all major markets. Real time data from Parcl Labs picked this up as it was happening, and, in the nearly two months since, show a continued but slowing recovery, with many markets up low/mid single digit percent from their end-May marks.

What are Parcl traders doing?
Parcl traders remain fairly balanced, though bearish skews are reemerging, notably in recent leaders Boston, Philadelphia, and Denver. Meanwhile, recent under-performer New York skews meaningfully long. Seven of the sixteen Parcl markets now skew short, a new Market Update high.
Total open interest across all Parcl pools exceeded $90,000 in USDC terms in June; highest OI markets as of July 3rd are New York, Boston, and Philadelphia.
Given the new bearish positioning, there may be contrarian opportunities, especially in regional markets with stronger relative fundamental trends. Contrarian positions can be particularly attractive to traders that have a counter or market neutral view on Parcl markets with funding rate arbitrage opportunities.
Austin, Texas recently made its debut as the newest tradable city on Parcl. Stay tuned for more cities coming soon! 🇺🇸 + 🇫🇷
New functionality: Absorption Rates
Check out new research tool functionality within each Parcl’s landing page. Below is the latest for the New York Parcl, which is showing a declining absorption rate. This indicates that there is a lower percentage of executed sales relative to available inventory and could indicate that the market is cooling.

Disclaimer: This article has been written purely for educational purposes. This article is not intended to be investment advice of any kind.