Market Update: May 2023
Residential real estate prices are on the rise with May experiencing a +2.2% MoM increase across 15 tradable Parcl markets.

Parcl Team
Jun 5, 2023

What Parcl Traders Need to Know
Residential real estate prices (ppsft) in the fifteen tradable Parcl markets continued to rise broadly. These markets finished May up an average of +2.2% month on month (MoM). This follows +2.0% gains in April.
Northeast markets including New York, Washington DC, Boston, Chicago, and Philadelphia outperformed in May, consistent with, but ahead of, typical seasonality.
Los Angeles, Miami Beach, Brooklyn, Seattle, and San Francisco underperformed; all were down MoM in May. Notably, LA, Miami Beach, and Brooklyn were leaders in April.
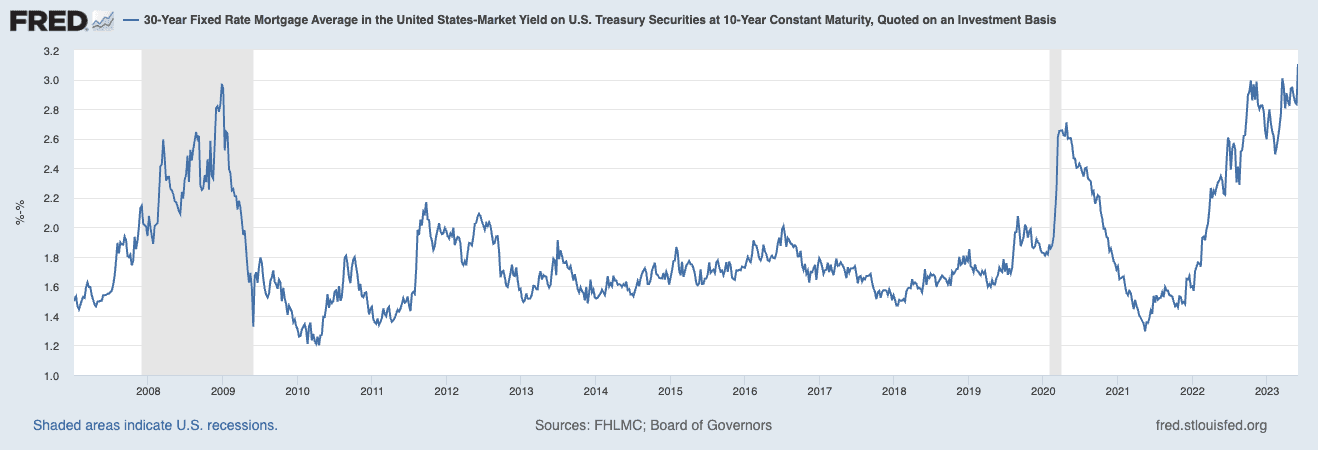
The spread between 30 year mortgage rates and the 10 year U.S. Treasury yield is the widest it has been in nearly 40 years.
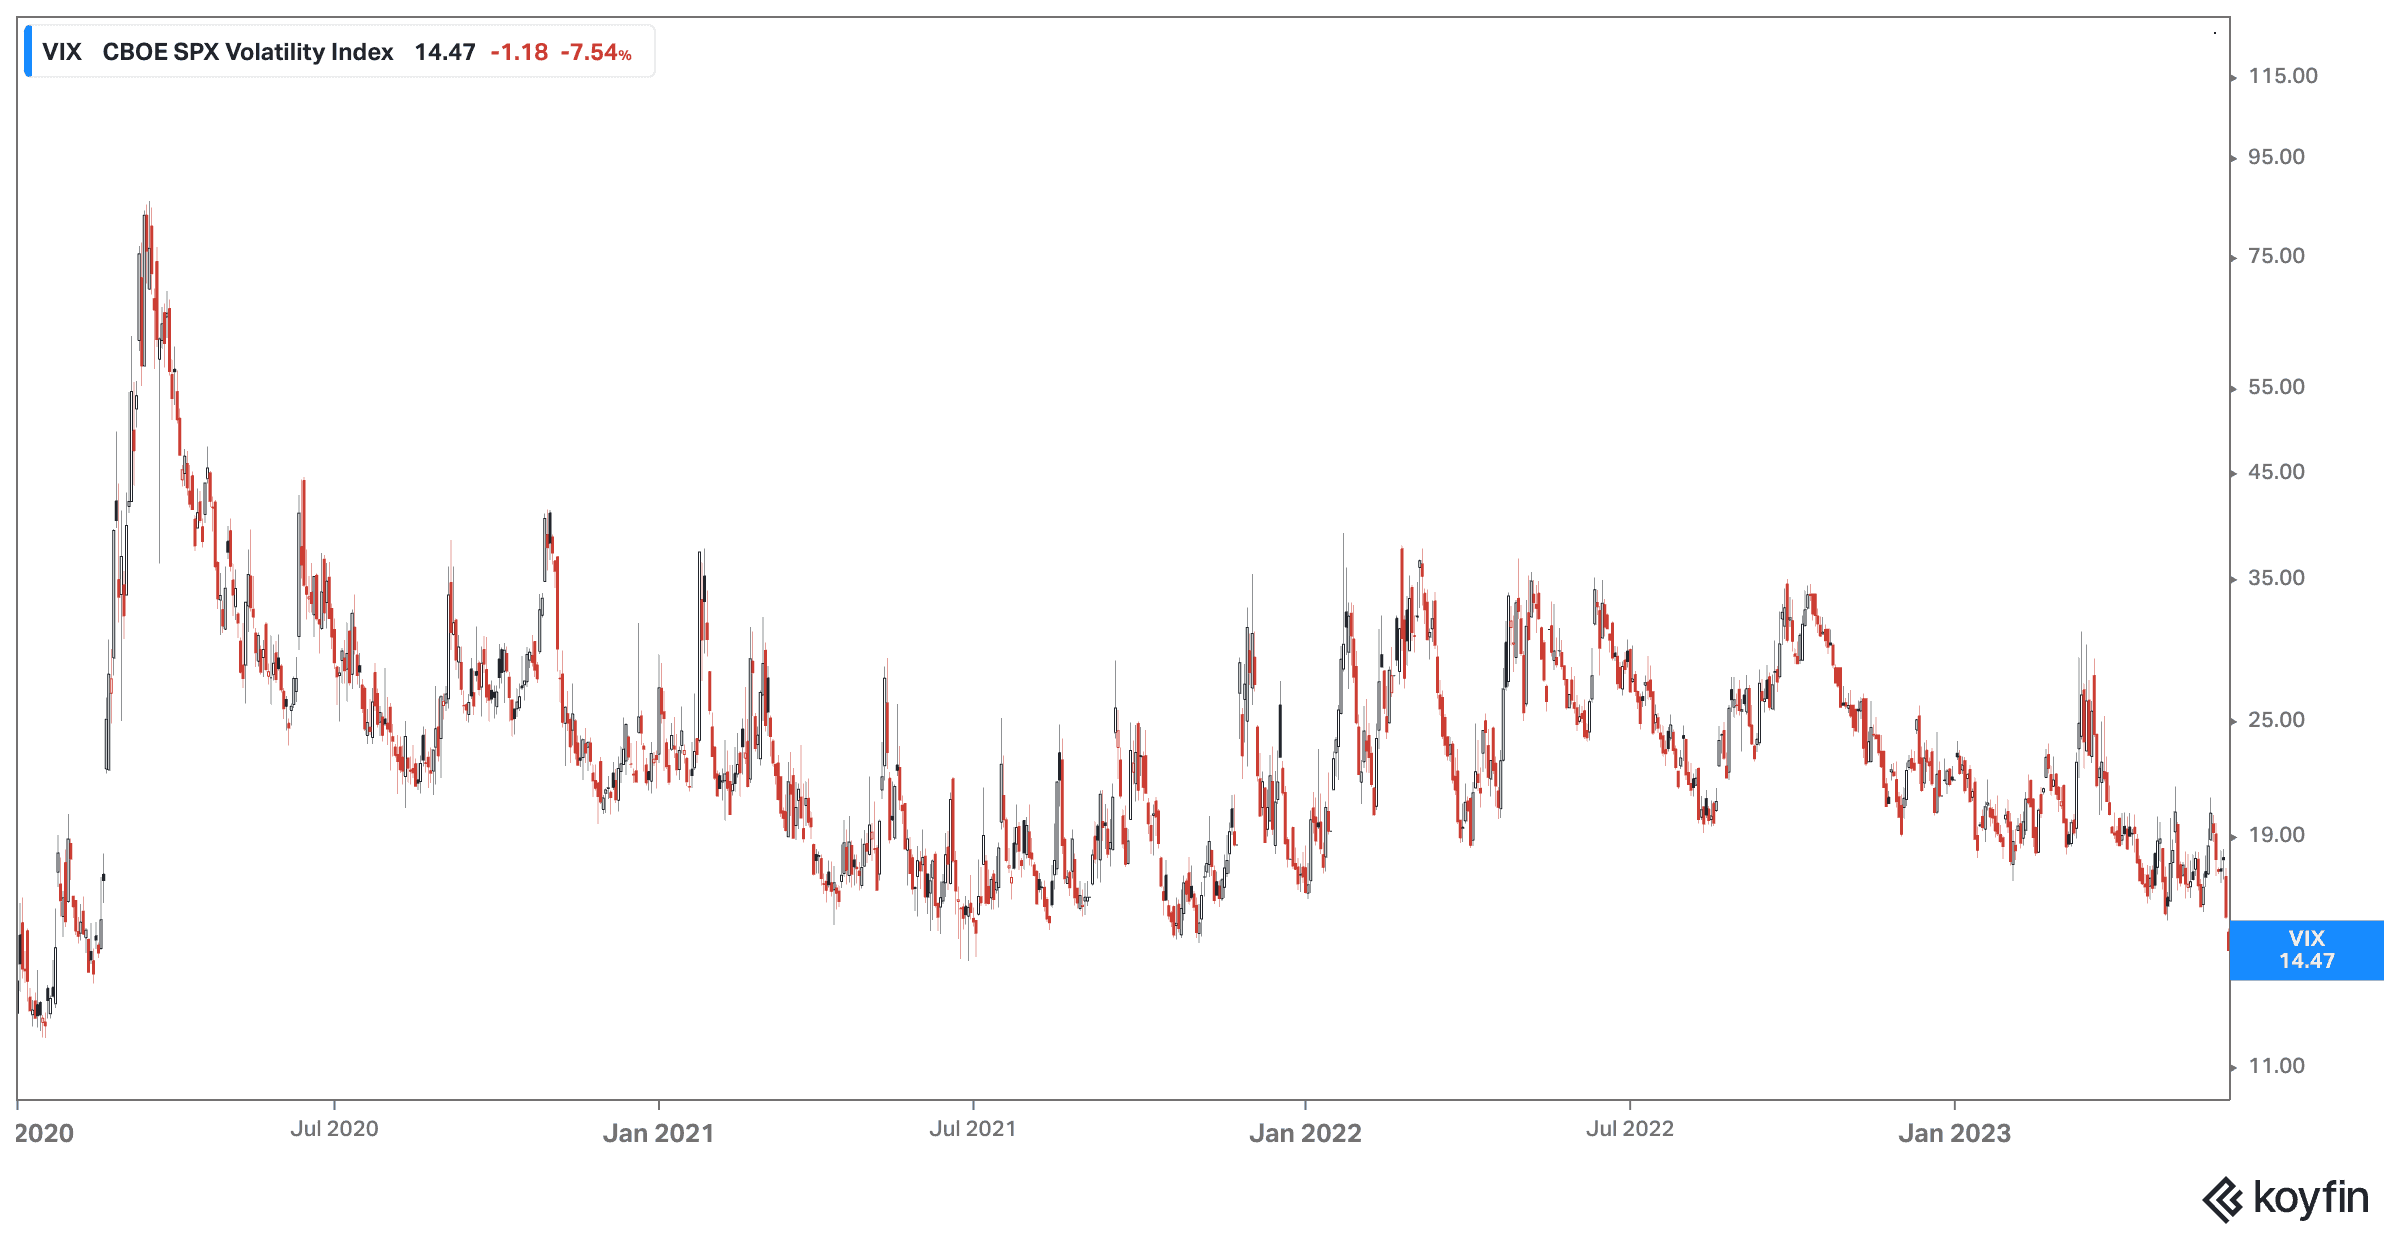
Parcl traders are quite balanced relative to previous updates. Notably, six of fifteen Parcl markets now skew short, a new high. The more balanced skew is an interesting contrast to three year lows in volatility (VIX Index) and recent sharp increases in equities.
Several of the six markets that skew short were the largest winners in April: Los Angeles (66% short), New York (64% short), and Philadelphia (64% short). New York was also the top performing market in May.
New YTD leader Boston skews nearly 75% long as traders appear to expect a continuation of recent gains. Prior YTD leader Miami Beach returns to >80% long after having had a roughly even long/short split in the previous update.
The state of real time real estate prices
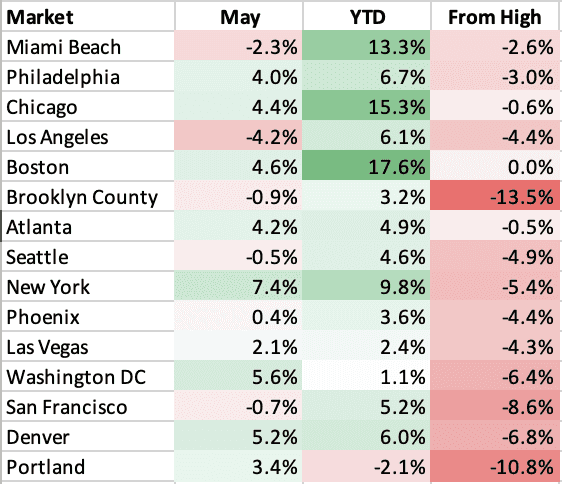
Final May data shows that some residential real estate markets experienced meaningful price increases MoM, while others saw a decline. This is a continuation of the trend of regional divergence that has persisted for much of the past ~12 months, at all levels of geography (national regions, state vs. state, intra-metro, etc.) The average May increase across the 15 tradable Parcl markets was +2.2%, which followed average gains of +2.0% in April.
Some markets - such as New York (+7.4% in May, +9.8% YTD, down 5.4% from peak), Washington DC (+5.6%, +1.1%, -6.4%), Denver (+5.2%, +6.0%, -6.8%), and Boston (+4.6%, +17.6%, all time high) - have risen at a more significant pace. Laggards in May were largely April winners; Los Angeles (-4.2%, +6.1%, -4.4%), Miami Beach (-2.3%, +13.3%, -2.6%), and Brooklyn (-0.9%, +3.2%, -13.5%); all were down MoM in May.
Much of May performance was both a mean reversion and leadership transfer across different markets, and also showed a continuation of the trend of regional divergence that has persisted for much of the past ~12 months, at all levels of geography (national regions, state vs. state, intra-metro, etc.)
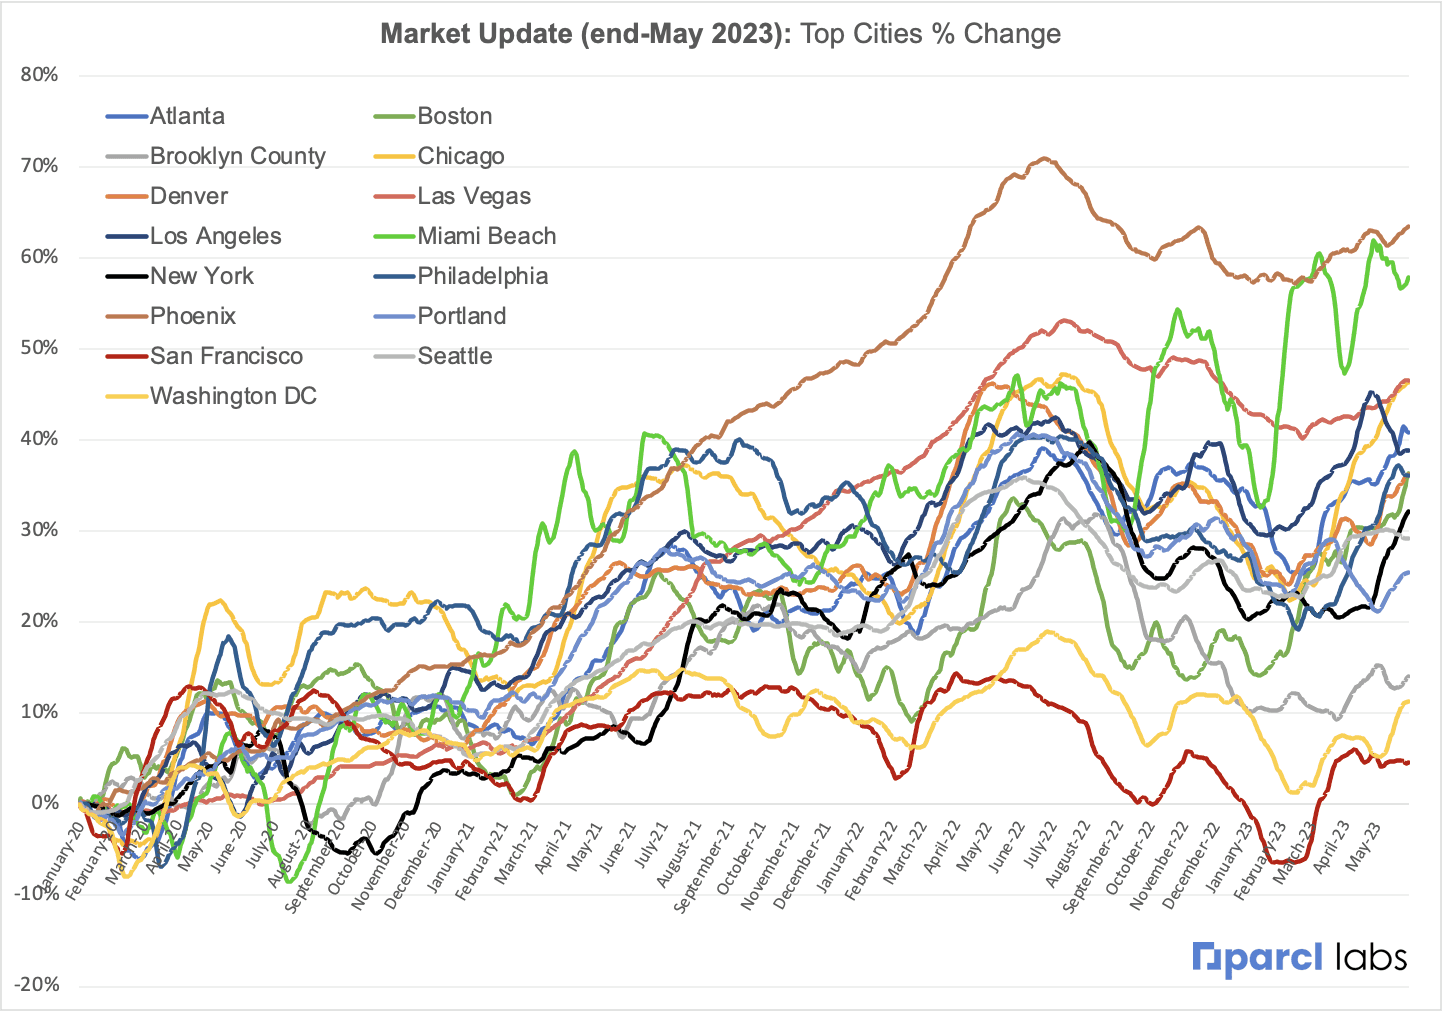
Boston reached an all-time high exiting May. Chicago and Atlanta are within 1% of their all-time highs, set earlier in May. Portland and Brooklyn both remain >10% from all time highs.
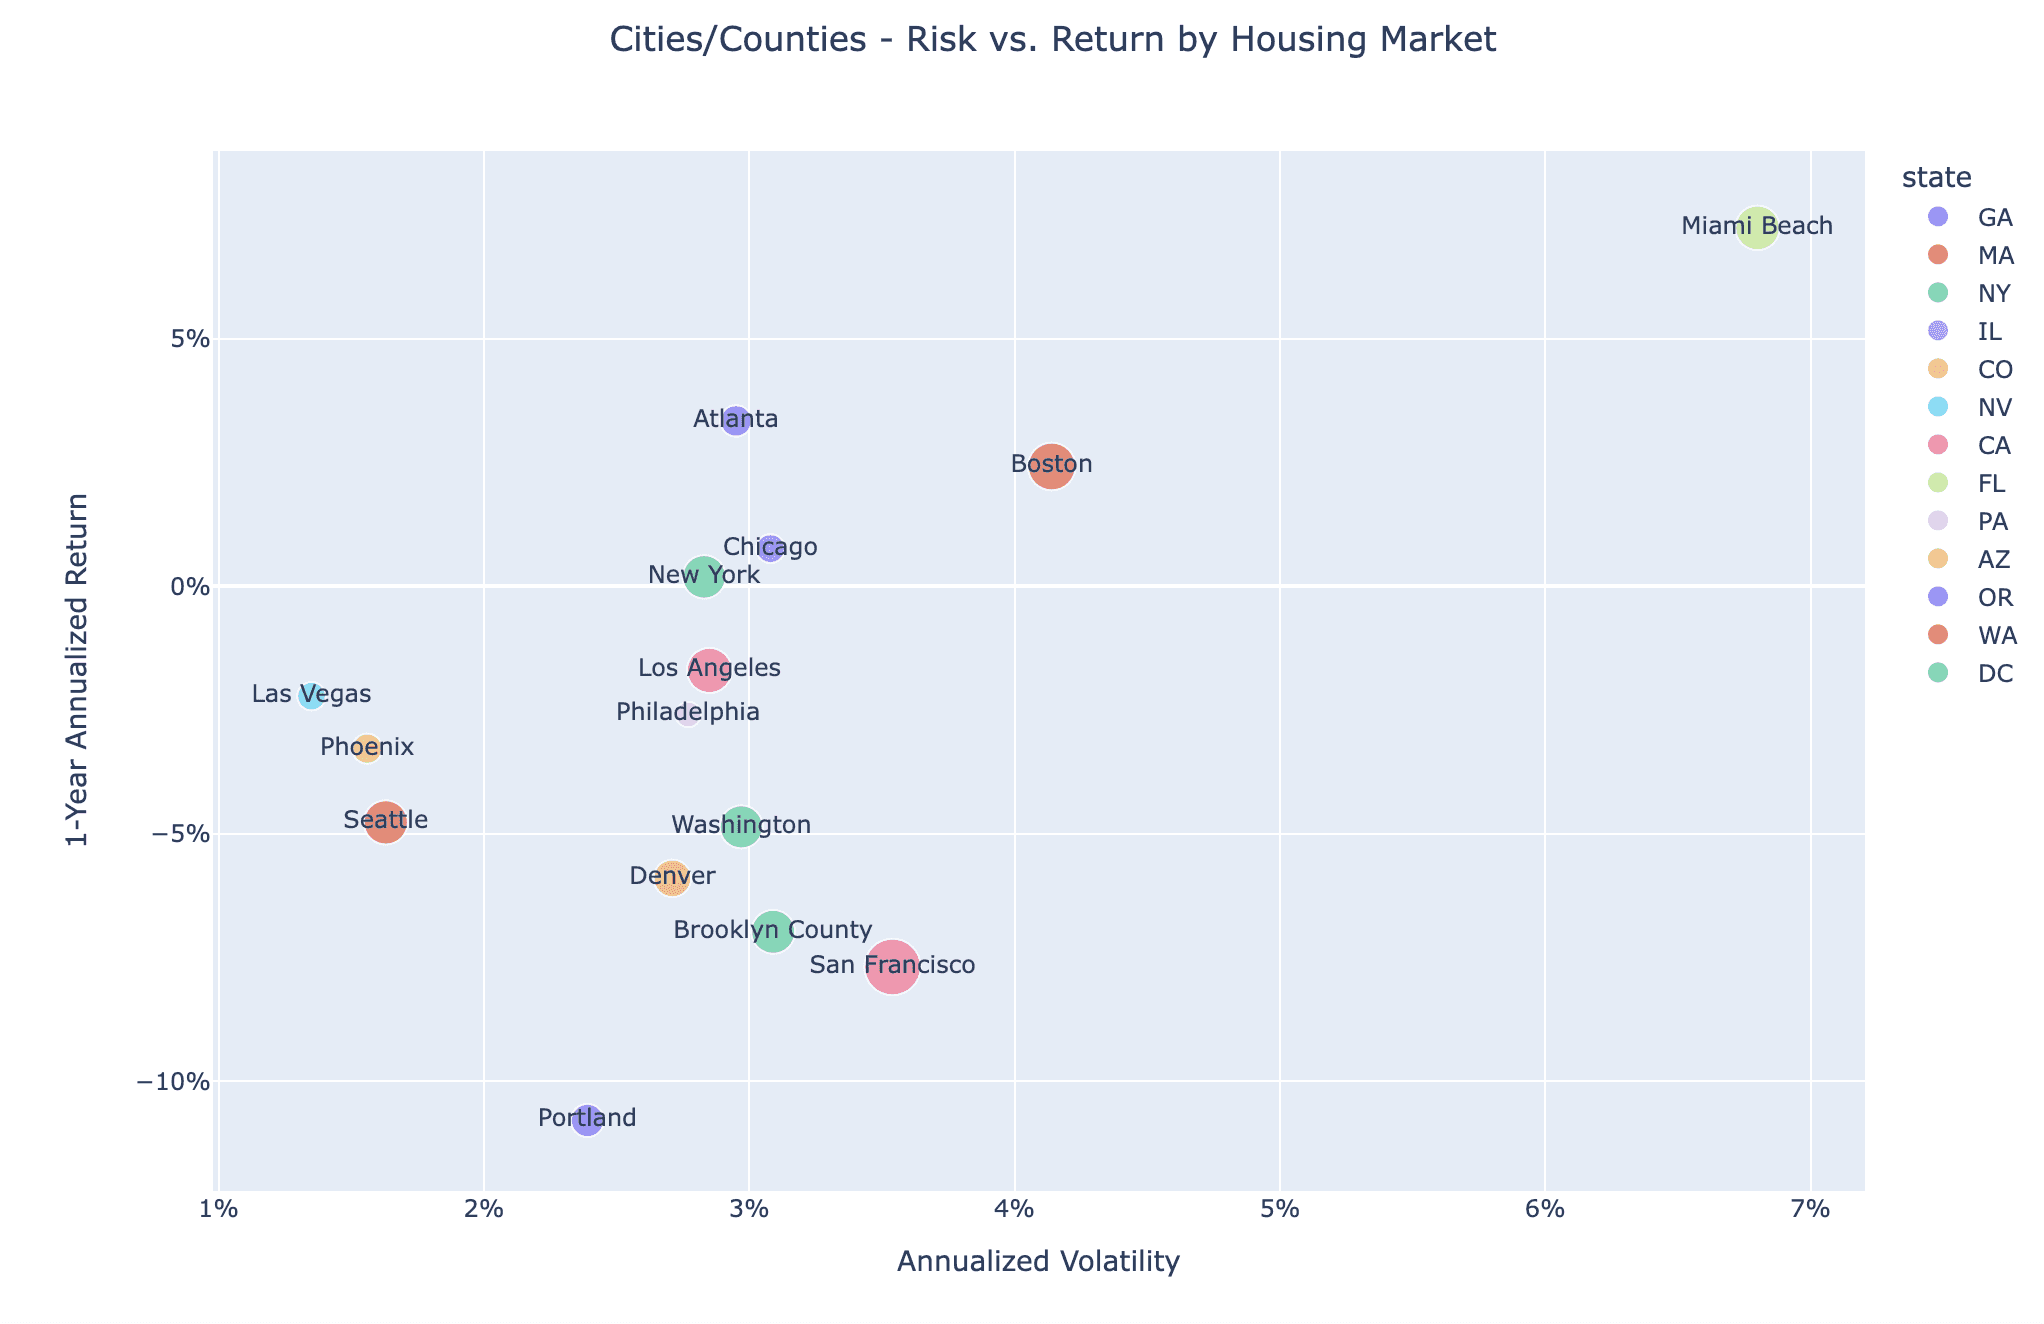
Miami and Boston continue to screen as top performers on a risk-adjusted basis. Portland, Brooklyn, and San Francisco screen as the worst risk-adjusted performers.
What factors are driving markets generally?
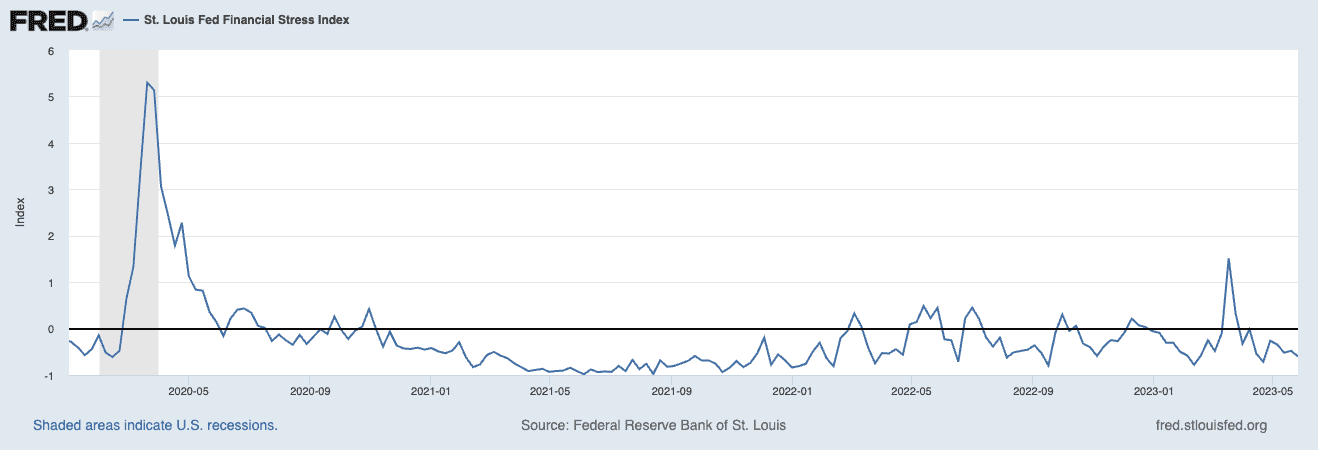
Volatility across markets continues to fall, with the VIX Index reaching three year lows exiting May. Volatility is well below the spike in March around bank solvency concerns, consistent with real time readings from the St. Louis Fed Financial Stress Index (below). This drop in volatitliy has coincided with an apparent stabilization in risk appetite; treasury yields remain flat from mid-march, while equity markets are now up double digits.
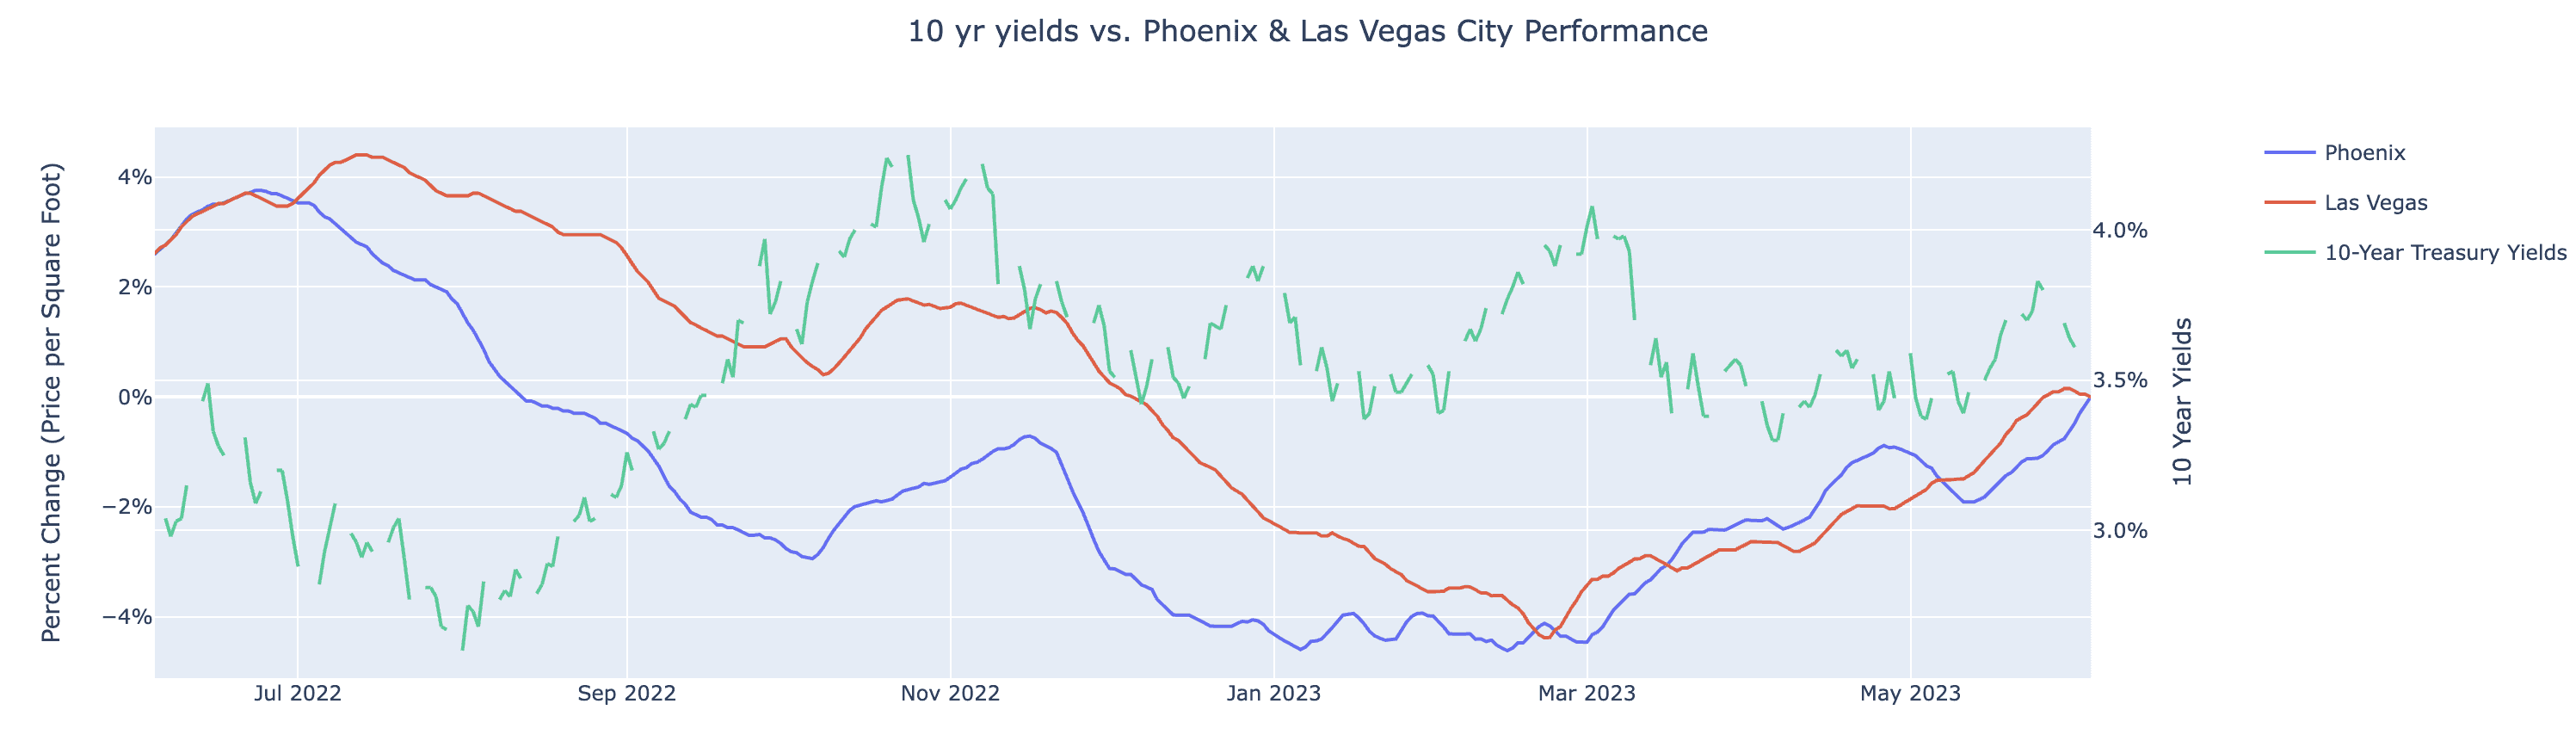
On the other hand treasury yields continue to exhibit elevated realized volatility, which has an impact on myriad downstream elements, such as mortgage rates and demand for housing. Phoenix and Las Vegas are two regional US real estate markets that exhibit among the highest negative correlations to real time changes in interest rates.
The spread between 30 year mortgage rates and the 10 year U.S. Treasury yield is the widest it has been in nearly 40 years. Should this spread mean revert somewhat, and the 10y Treasury remains unchanged or continues to decline, this could perhaps create an additional tailwind for residential real estate demand near term. Important to note, the magnitude is diminished when adjusting for the effects of duration relative to the treasury yield curve.
The Case Shiller updated with March data on Tuesday 5/30, showing a continued broad recovery in prices across most markets. Real time data from Parcl Labs picked this up as it was happening, and, in the nearly two months since, show a strong recovery, with many markets up low/mid single digit percent from their end-March marks.
Parcl Team


