Market Report: May 3 2023
Parcl traders now have more balanced positioning across tradable markets. Plus, learn more about the current state of real time real estate prices.

Parcl Team
May 3, 2023

What Parcl Traders Need to Know
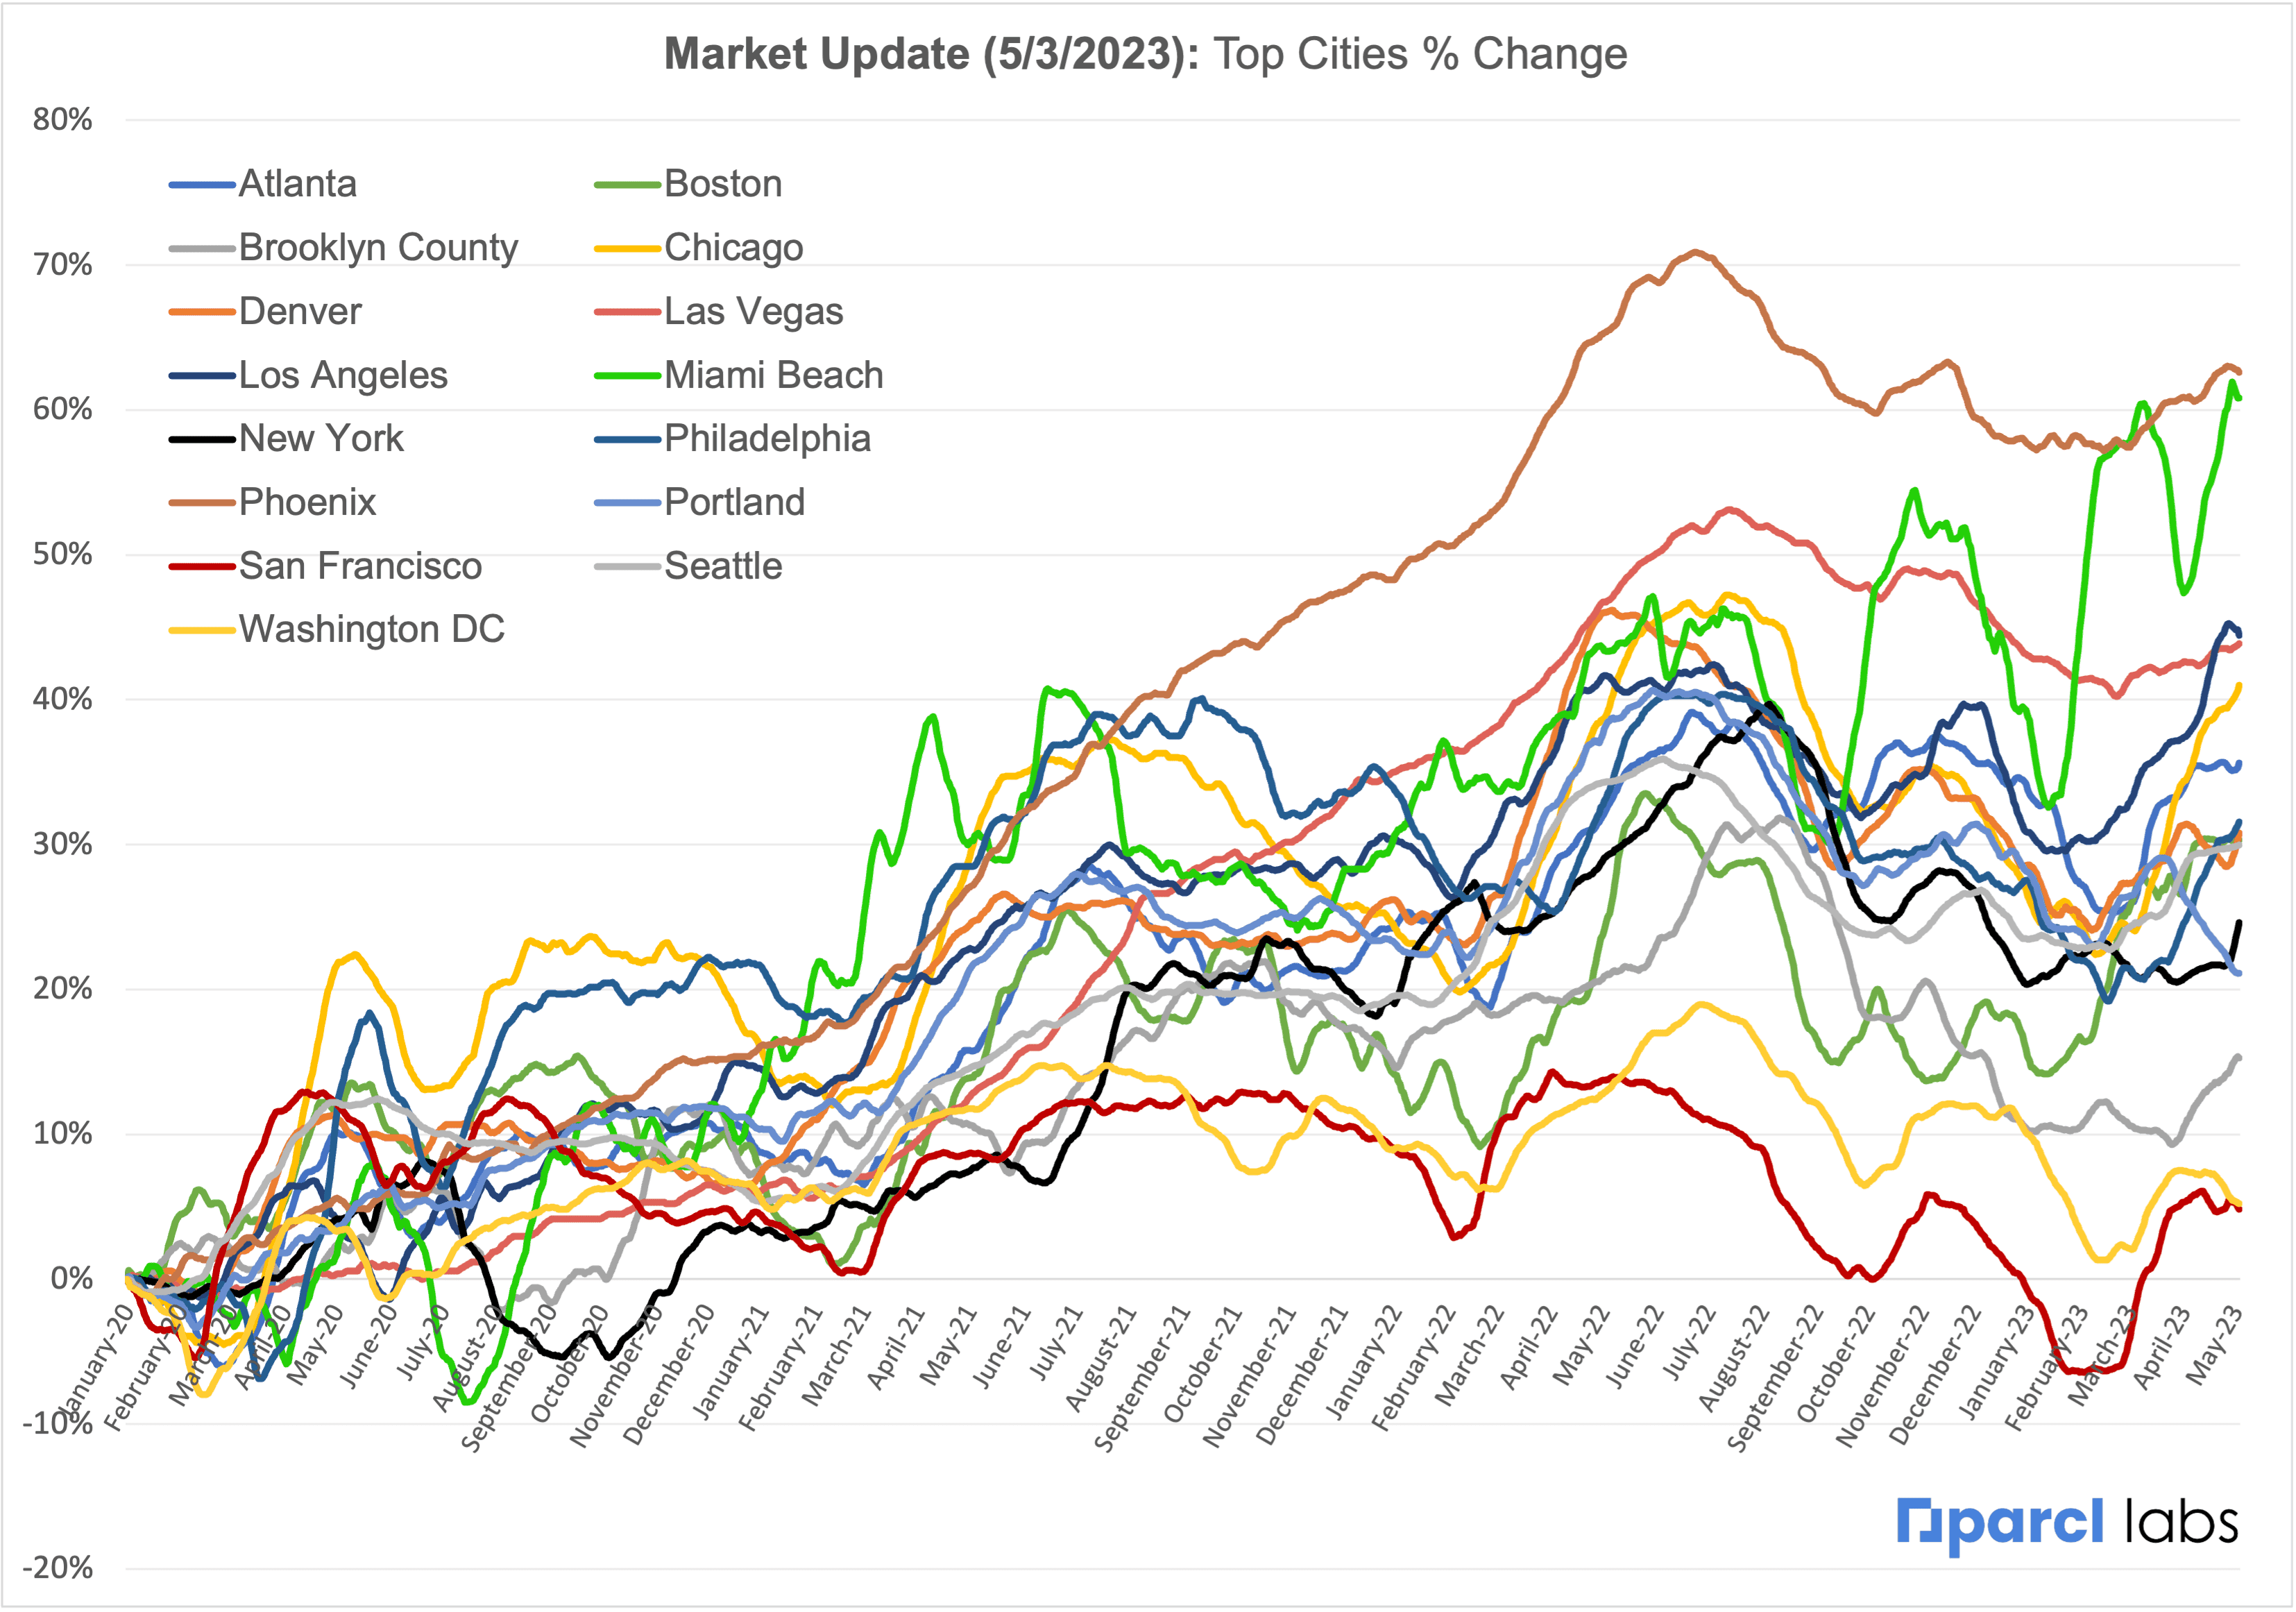
Residential real estate prices (ppsft) in the fifteen tradable Parcl markets continued to rise broadly. These markets finished April up an average of 2.0% month on month (MoM).
Some markets - such as Miami Beach, Los Angeles, Philadelphia, and Chicago - rose at an above average pace in April.
Portland, Denver, and Washington D.C. all lagged in April; each market was down vs. end-March. San Francisco was flat MoM.
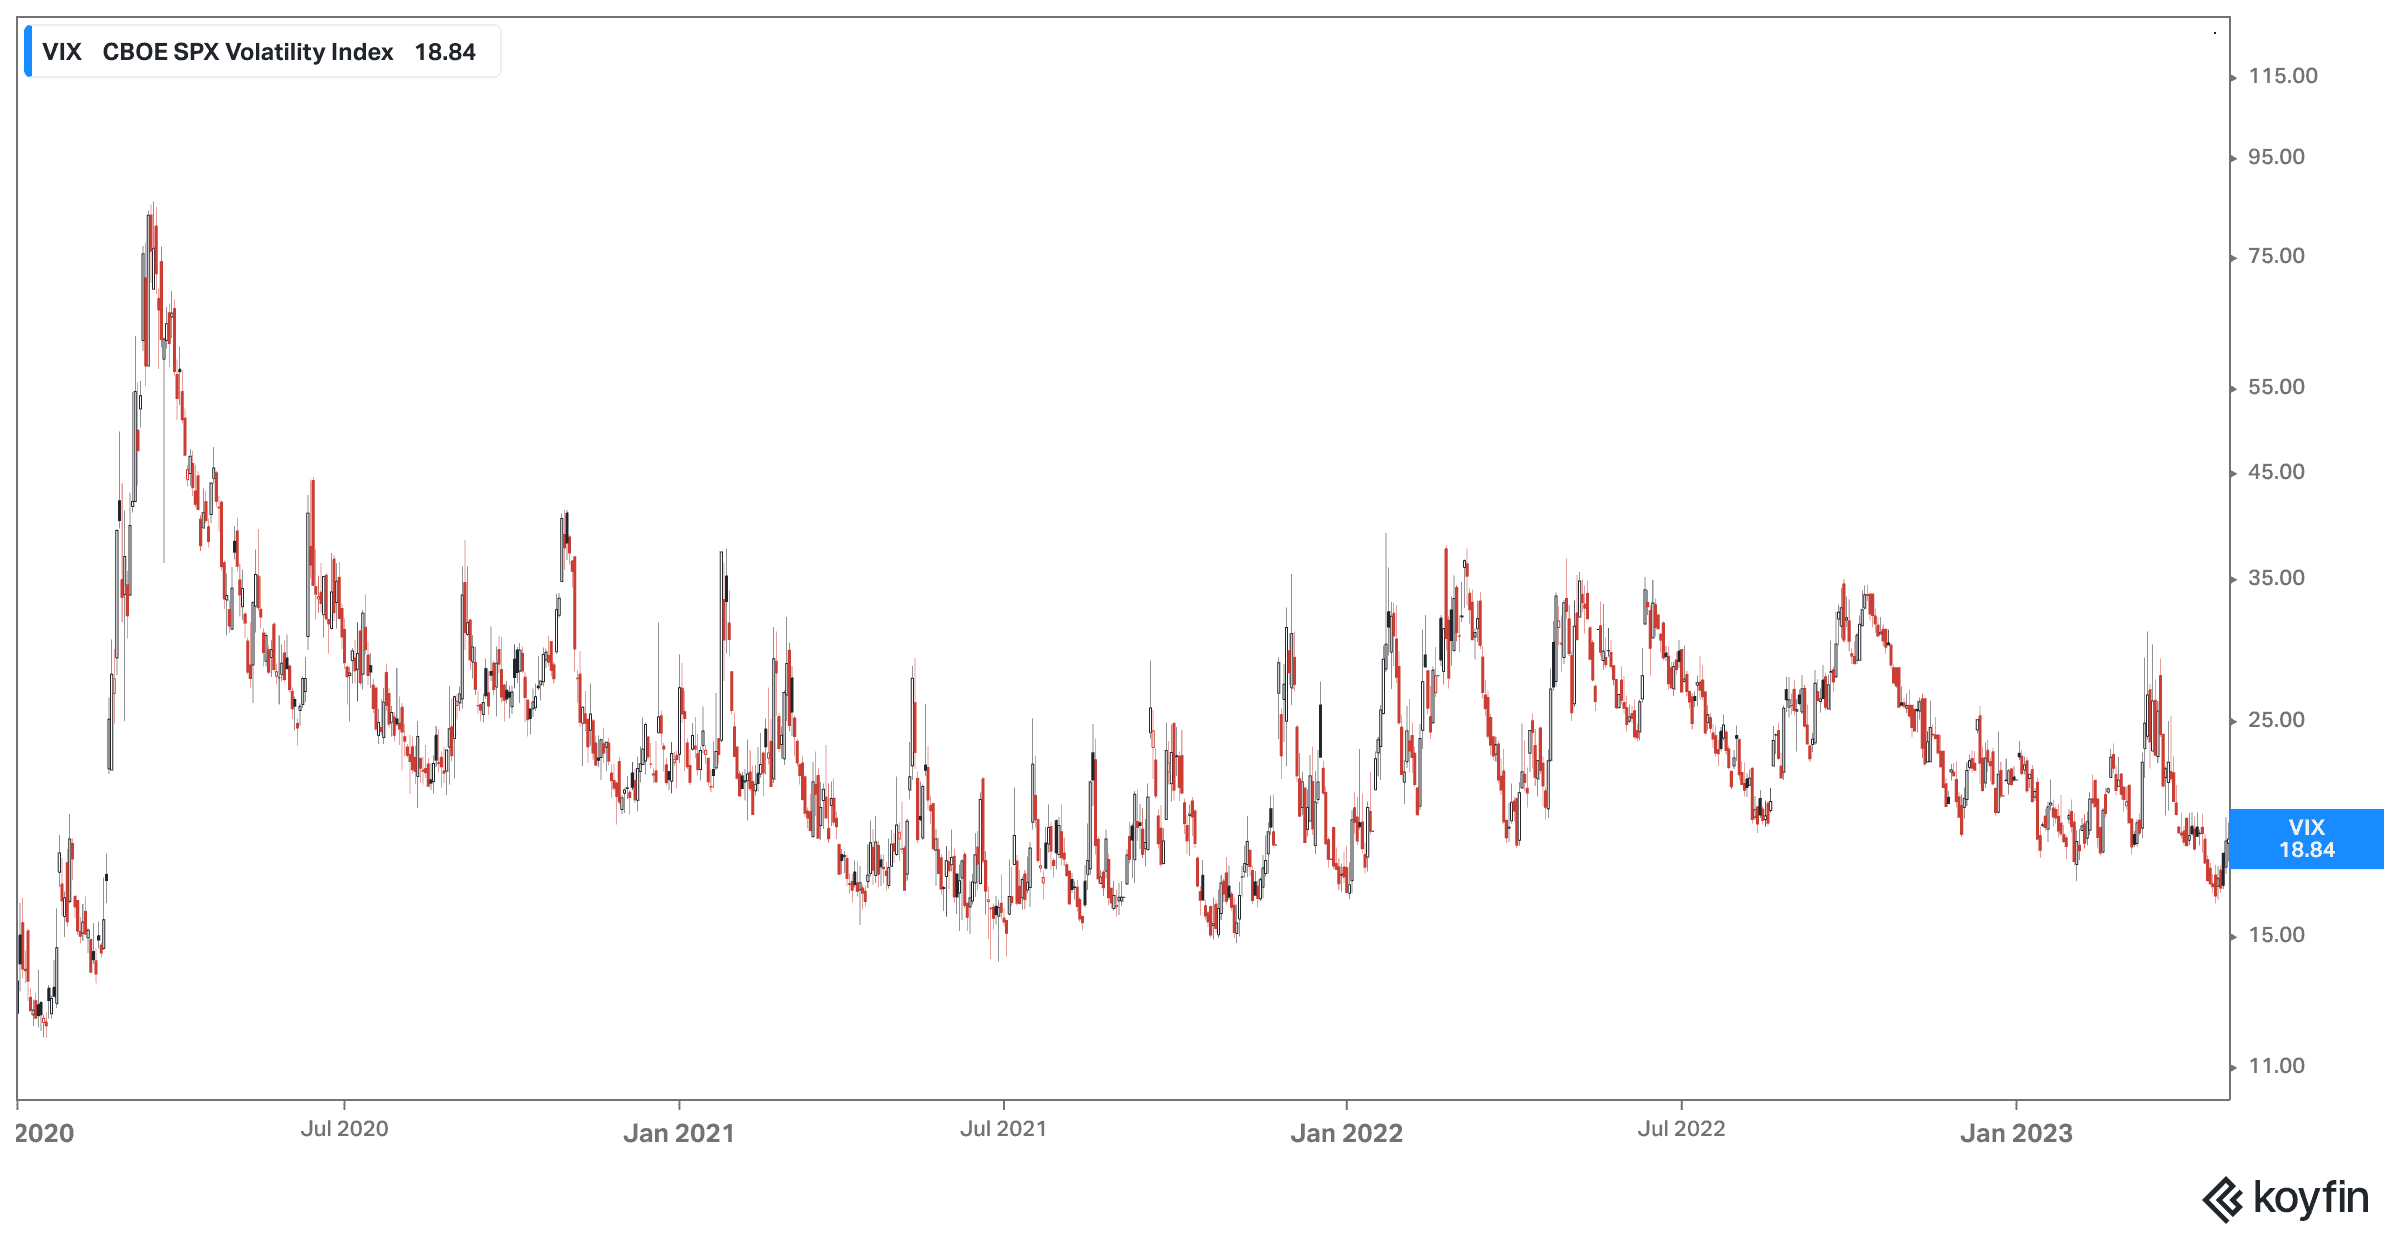
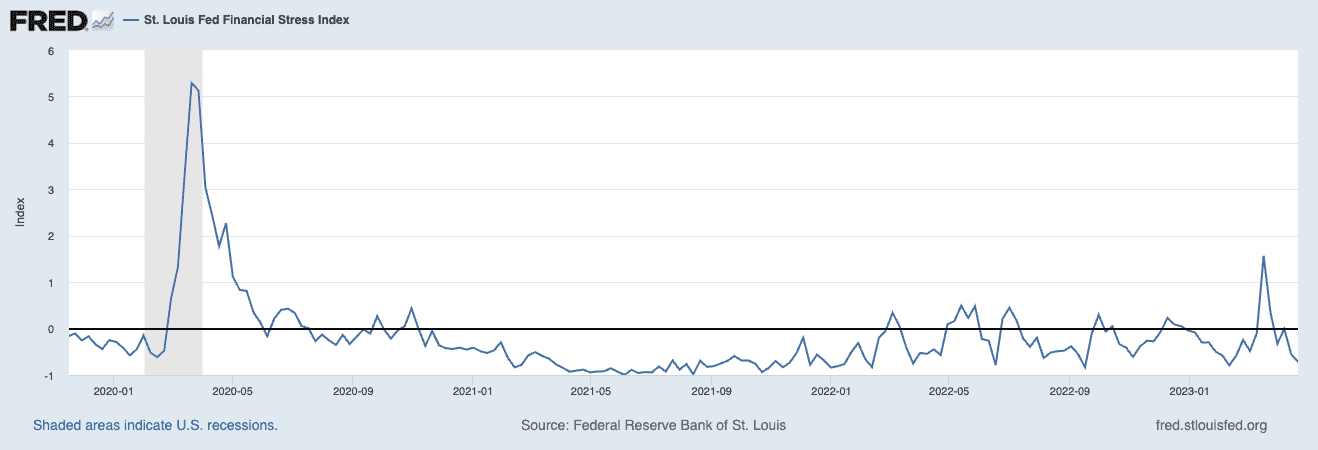
Volatility across markets & asset classes remains subdued following a recent spike around bank solvency concerns, though up modestly in recent weeks.
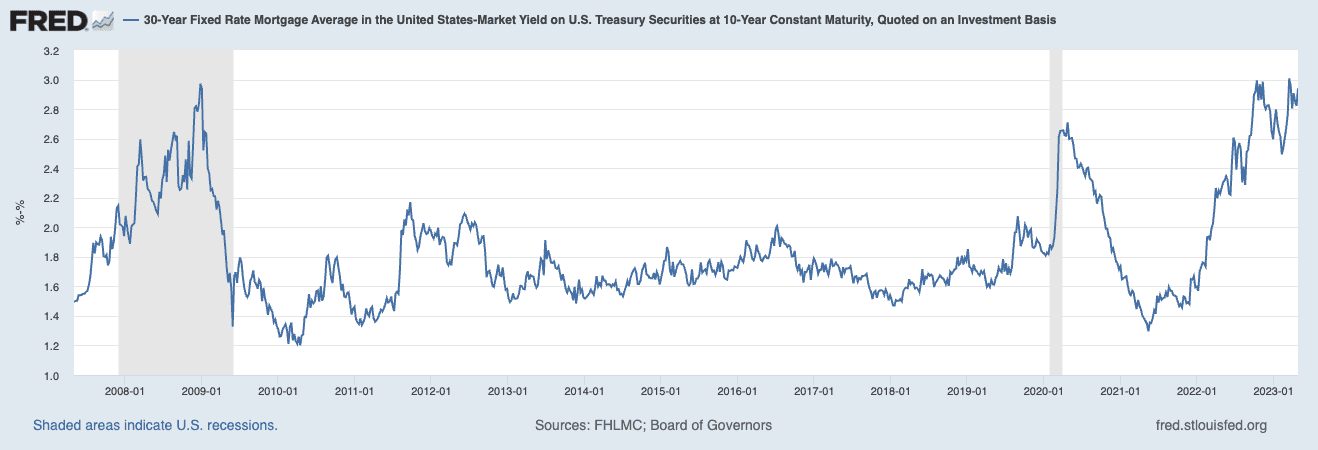
The spread between 30 year mortgage rates and the 10 year U.S. Treasury yield remains historically wide.
Parcl traders now have more balanced positioning across tradable markets; in prior weeks the majority of markets skewed meaningfully long. Notable outliers include Portland (>65% long), Denver (>80% long), Las Vegas (~65% long), San Francisco (>70% short), and Phoenix (>65% short).
Total open interest across all Parcl pools reached $50,000 in USDC terms; highest OI markets are Chicago, Miami Beach, and New York.
The state of real time real estate prices
Final April data shows that some residential real estate markets experienced meaningful price increases MoM, while others saw a decline. This is a continuation of the trend of regional divergence that has persisted for much of the past ~12 months, at all levels of geography (national regions, state vs. state, intra-metro, etc.) Average April increase across the 15 tradable Parcl markets was +2.0%.
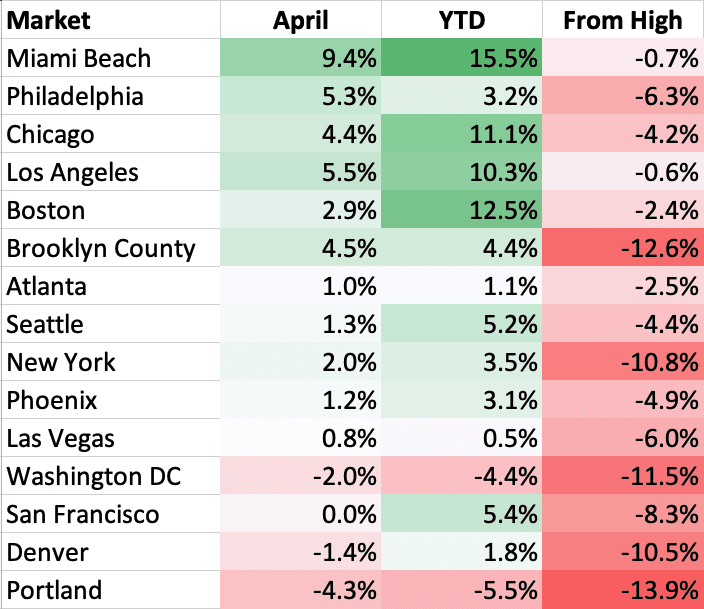
Miami Beach has recorded very strong April performance, with a 9.4% increase from end-March. Miami Beach now sits at +15.5% year-to-date (YTD), down only 0.7% from its peak, which it reached within April. Los Angeles also saw a 5.5% increase in prices in April, a 10.3% YTD increase, and a decrease of only 0.6% from its peak, also reached within April. Other markets that saw above average price gains include Philadelphia, Chicago, Boston, and Brooklyn County.
On the other hand, some markets have seen a decrease in prices, with Portland experiencing the biggest decline of 4.3% in April, a YTD decline of 5.5%, and a decrease of 13.9% from its peak. Denver and Washington D.C. have also seen a decrease in prices in April, with declines of 1.4% and 2.0%, respectively. However, compared to their peak prices, both markets are down more significantly at 10.5% and 11.5%, respectively. Las Vegas, New York, and Atlanta also experienced a modest decline in prices in April.
Miami & Los Angeles are within 1% of all time highs. Portland, Brooklyn, New York, Washington DC, and Denver all remain >10% from all time highs.
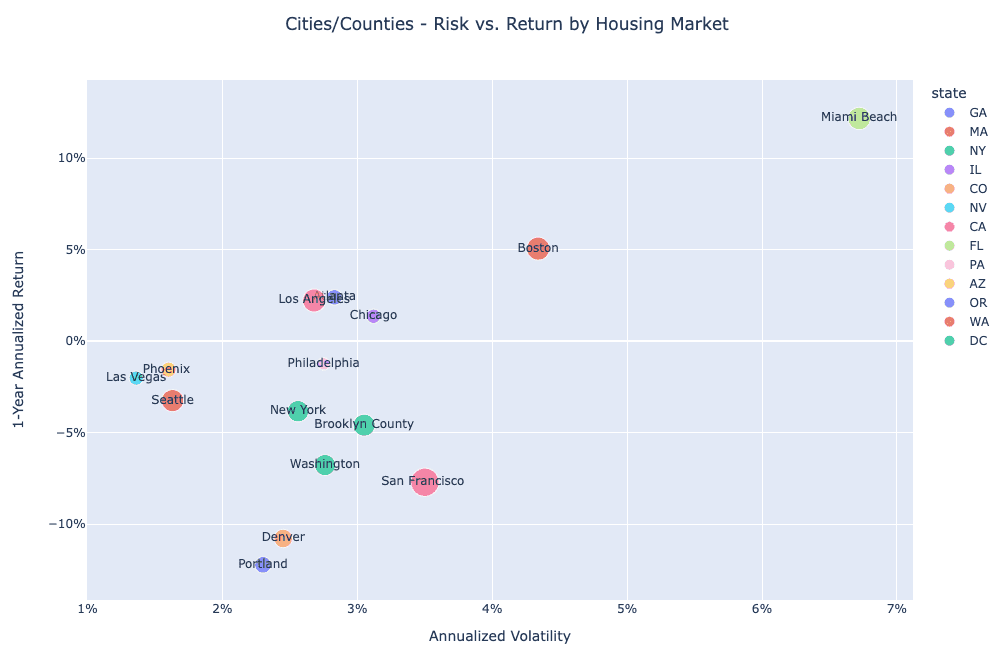
Miami and Boston continue to screen as top performers on a risk-adjusted basis. Portland, Denver, Portland and San Francisco screen as the worst performers.
What factors are driving markets generally?
Volatility across markets remains relatively subdued, though up again week over week, as evidenced by the VIX Index. Volatility remains well below the spike in March around bank solvency concerns, consistent with real time readings from the St. Louis Fed Financial Stress Index (below). This has led to an apparent stabilization in risk appetite; treasury yields remain flat from mid-march, while equity markets are up mid/high single digits.
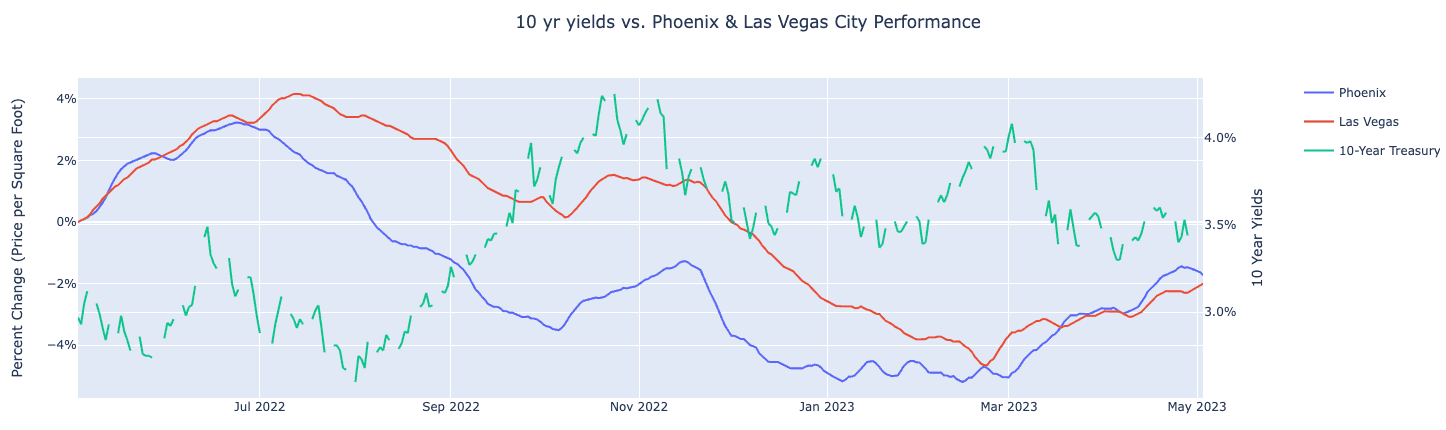
On the other hand treasury yields continue to exhibit elevated realized volatility, which has an impact on myriad downstream elements, such as mortgage rates and demand for housing. Phoenix and Las Vegas are two regional US real estate markets that exhibit among the highest negative correlations to real time changes in interest rates.
The spread between 30 year mortgage rates and the 10 year U.S. Treasury yield remains historically wide. Should this spread mean revert somewhat, and the 10y Treasury remains unchanged or continues to decline, this could perhaps create an additional tailwind for residential real estate demand near term.
The Case Shiller updated with February data on Tuesday 4/25, showing a modest but broad recovery in prices across most markets. Real time data from Parcl Labs picked this up as it was happening, and, in the nearly two months since, show a strong recovery, with many markets up low/mid single digit percent from their end-February marks.
Parcl Team


