Market Update: June 16th 2023
June is taking us for a ride on the real estate rollercoaster! But the tide seems to be turning.

Parcl Team
Jun 16, 2023

What Parcl Traders Need to Know
The fifteen tradable Parcl markets so far average a 0.9% MTD rise in residential real estate prices (ppsft), compared to May's 2.2% and April's 2.0% gains.
Current standouts, Philadelphia, Boston, and Brooklyn, set the pace with significant MTD and YTD rises, with Philadelphia hitting an all-time high.
Meanwhile, New York, Portland, and Denver all are experiencing a downturn this month.
Traders remain fairly balanced, though bullish skews are reemerging, notably in recent leaders Philadelphia, Boston, and Brooklyn but also in recent laggards like Los Angeles.
Austin, Texas makes its debut as the newest tradable city on Parcl. Stay tuned for more cities coming soon! 🇫🇷
The state of real time real estate prices
Residential real estate prices have broadly risen month to date (MTD) in June, with the 15 tradable Parcl markets covered in this update now up 0.9% MTD, on average. This compares to +2.2% month on month in May and +2.0% gains in April.
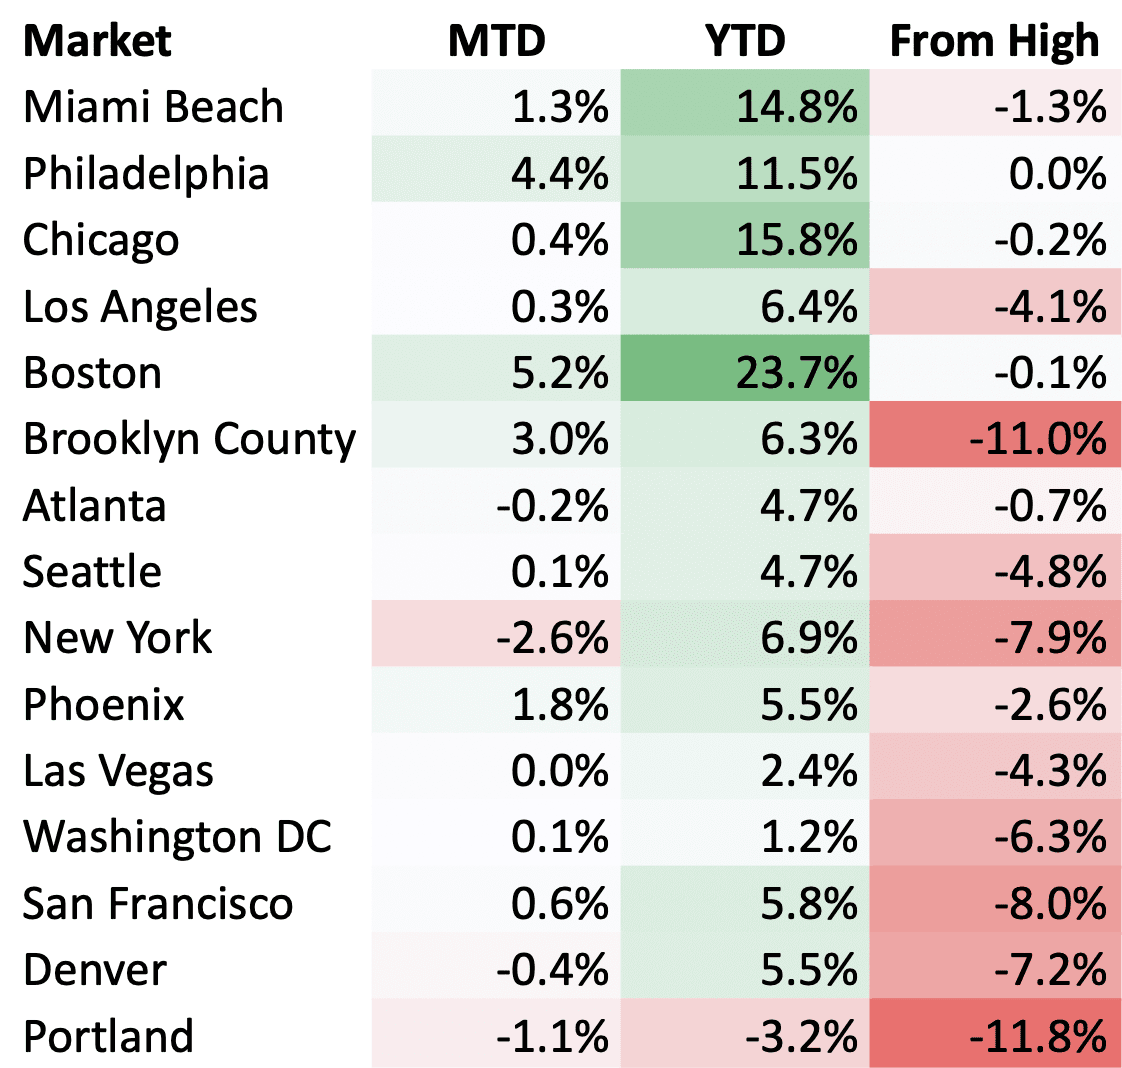
Some markets - such as Philadelphia (+4.4% MTD, +11.5% YTD, new all time high), Boston (+5.2% MTD, +23.7% YTD, -0.1% from peak), and Brooklyn (+3.0%, +6.3%, -11.0%) - have risen at a more significant pace. Laggards are New York (-2.6%, +6.9%, -7.9%), Portland (-1.1%, -3.2%, -11.8%), and the NBA Championship winning Denver (-0.4%, +5.5%, -7.2%); all are down MTD.
Much of May performance was both a mean reversion and leadership transfer across different markets, and also showed a continuation of the trend of regional divergence that has persisted for much of the past ~12 months, at all levels of geography (national regions, state vs. state, intra-metro, etc.). June is more of the same, at least amongst the MTD losers (New York, Portland, and Denver), each of which were May leaders.
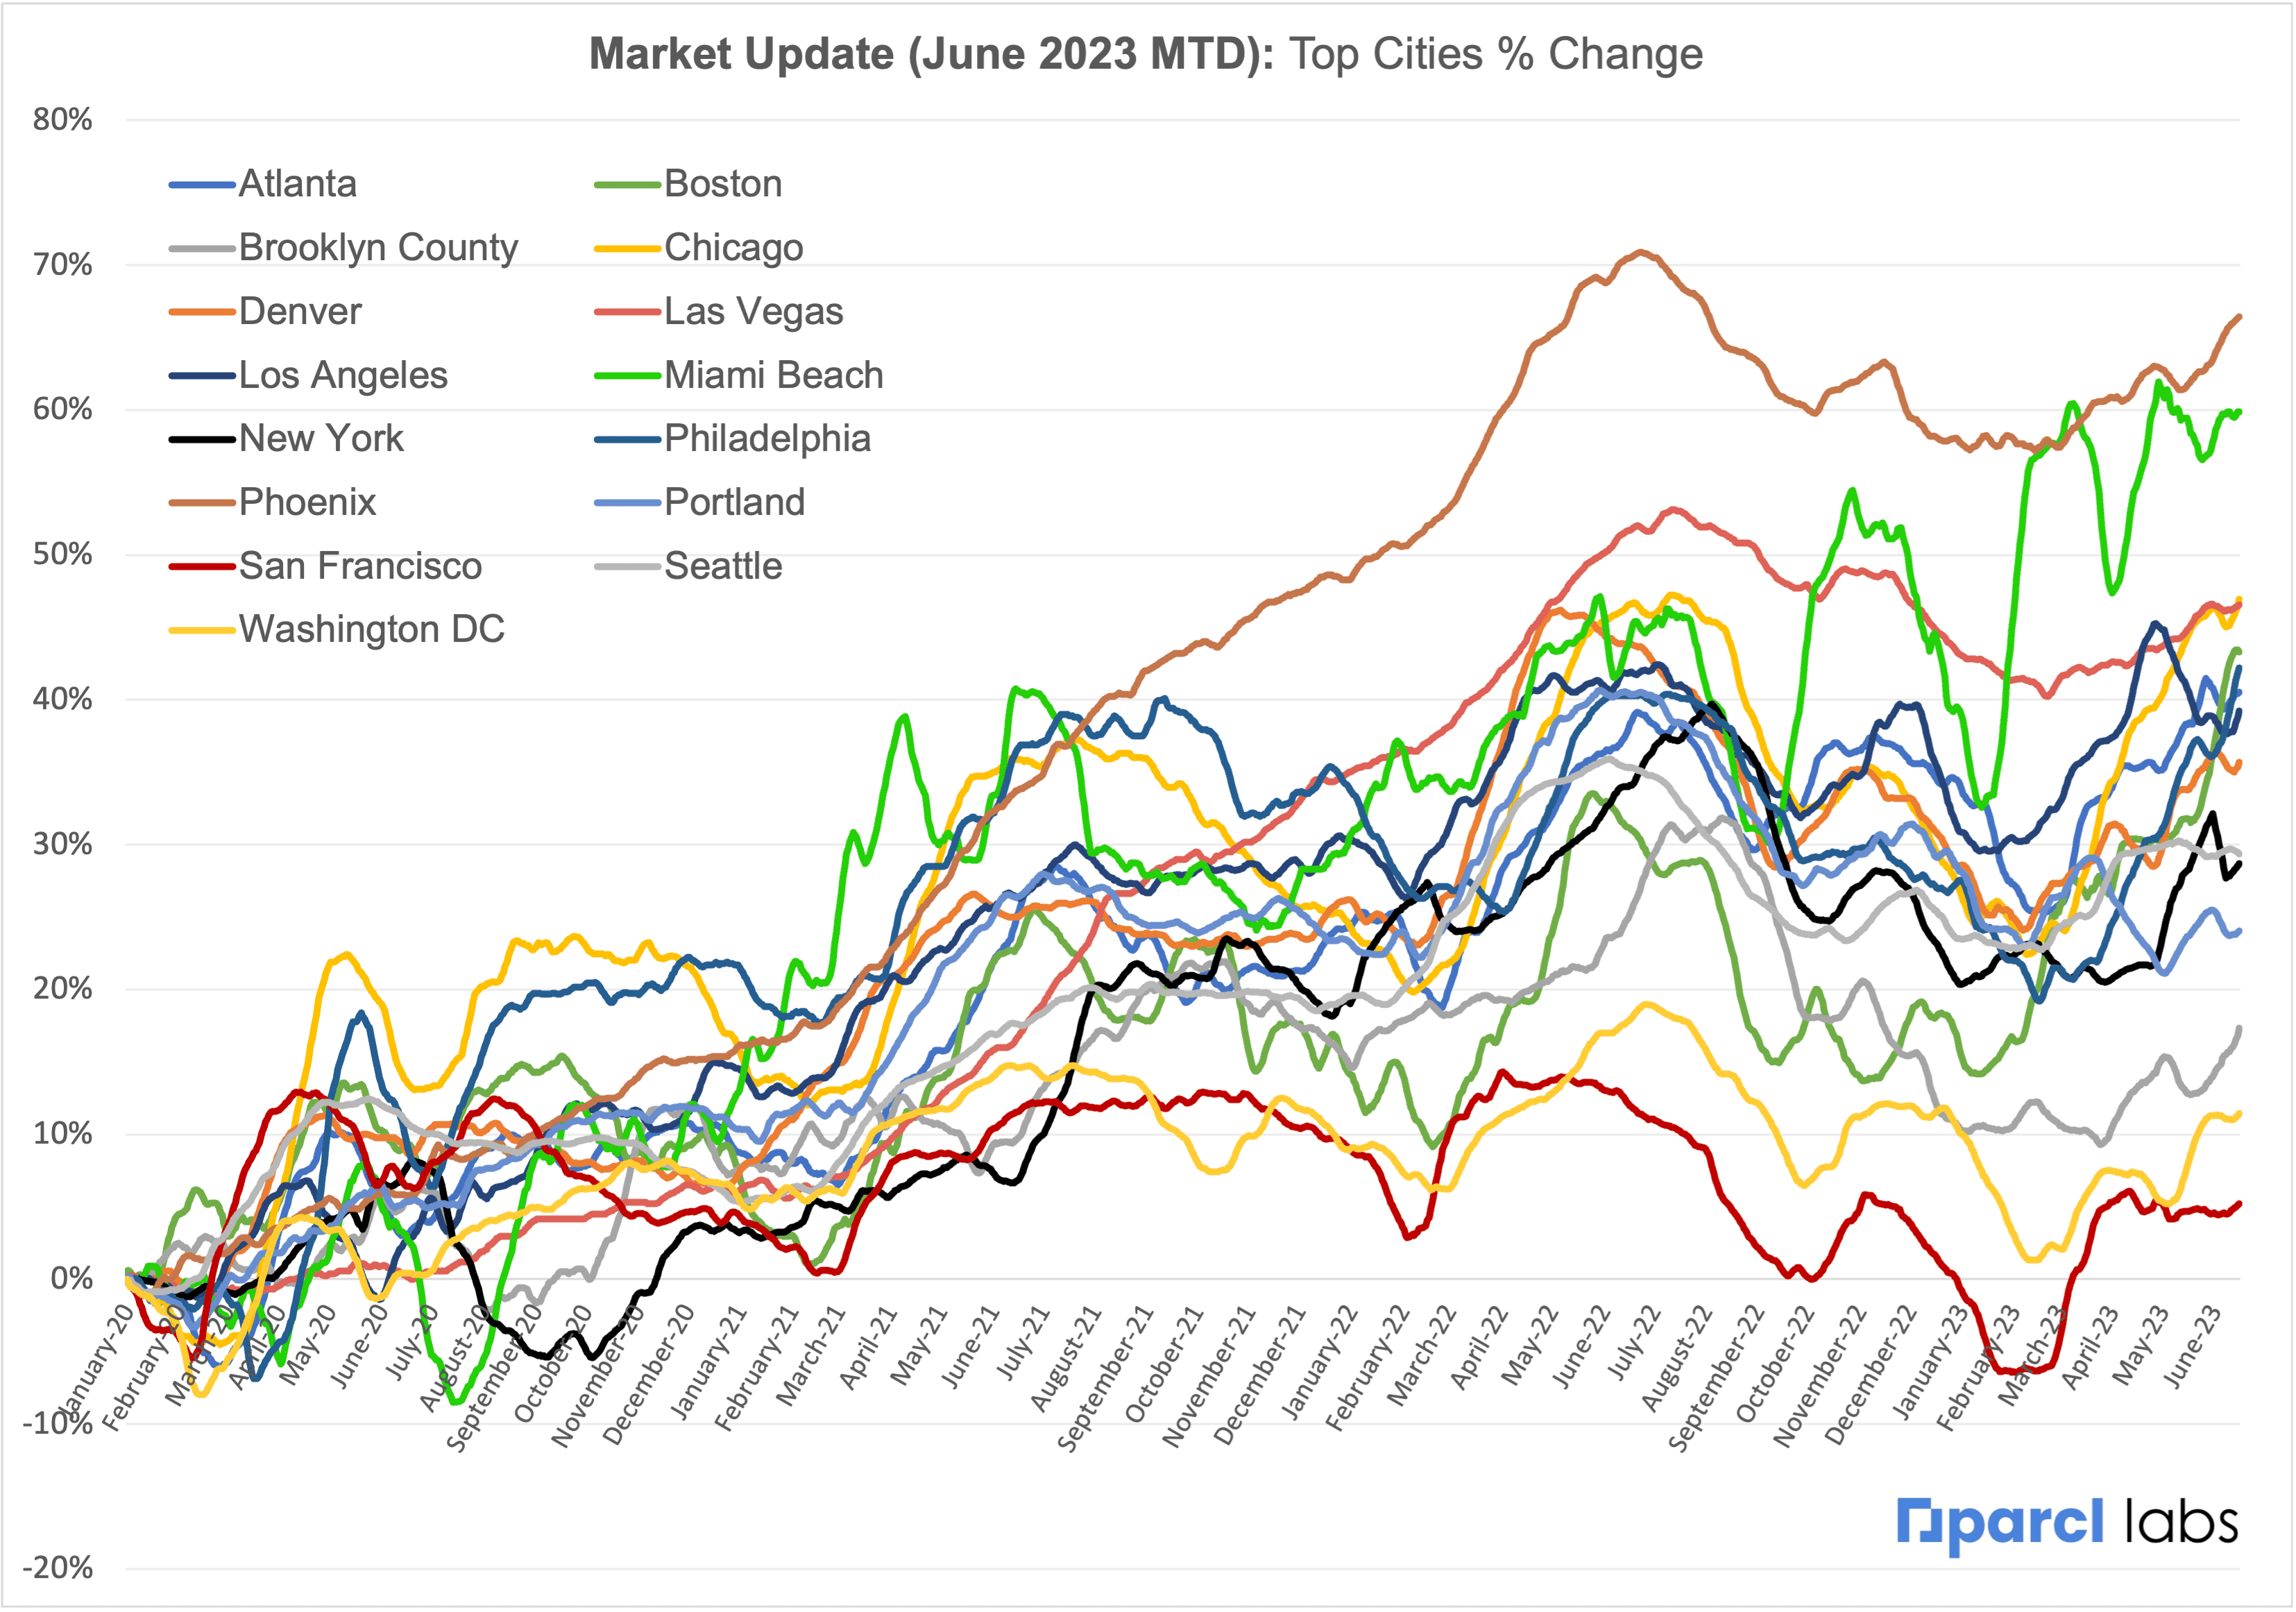
Philadelphia reached all time highs in this update. Boston, Chicago, and Atlanta are all within 1ppt of all time highs, each of which were reached within 2023. Miami Beach is 1.3% off its all time high, which it reached last month.
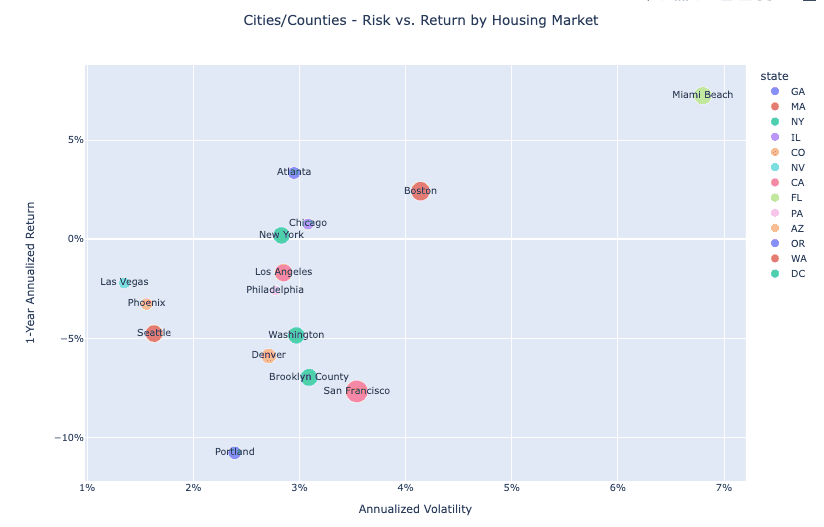
Miami and Boston continue to screen as top performers on a risk-adjusted basis. Portland, Denver, and San Francisco screen as the worst performers.
What factors are driving markets generally?
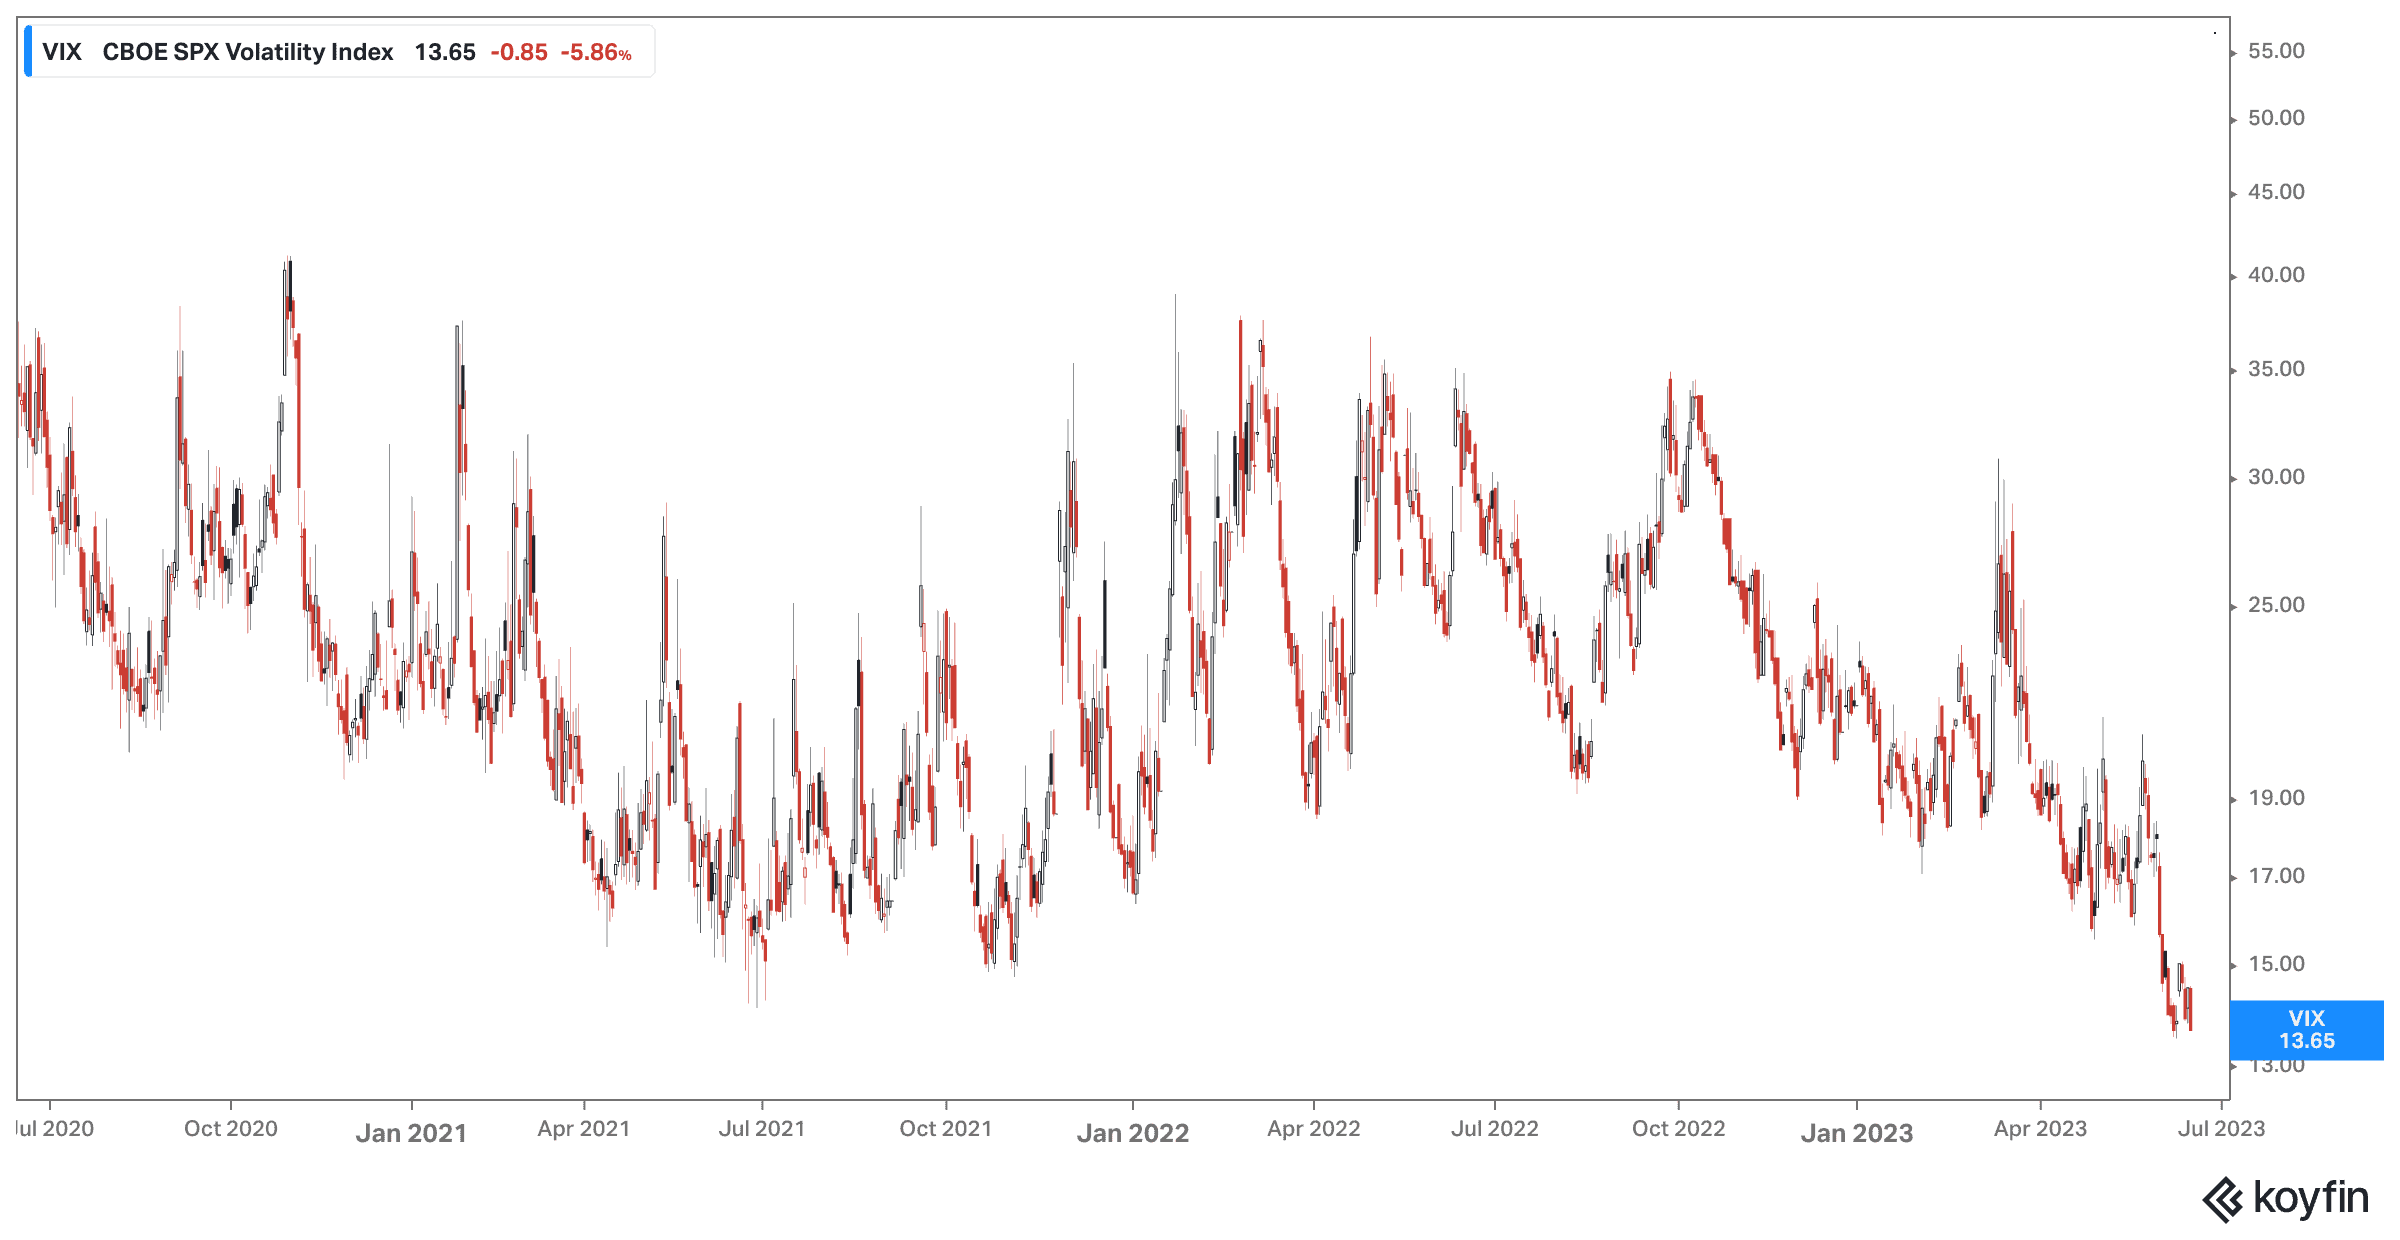
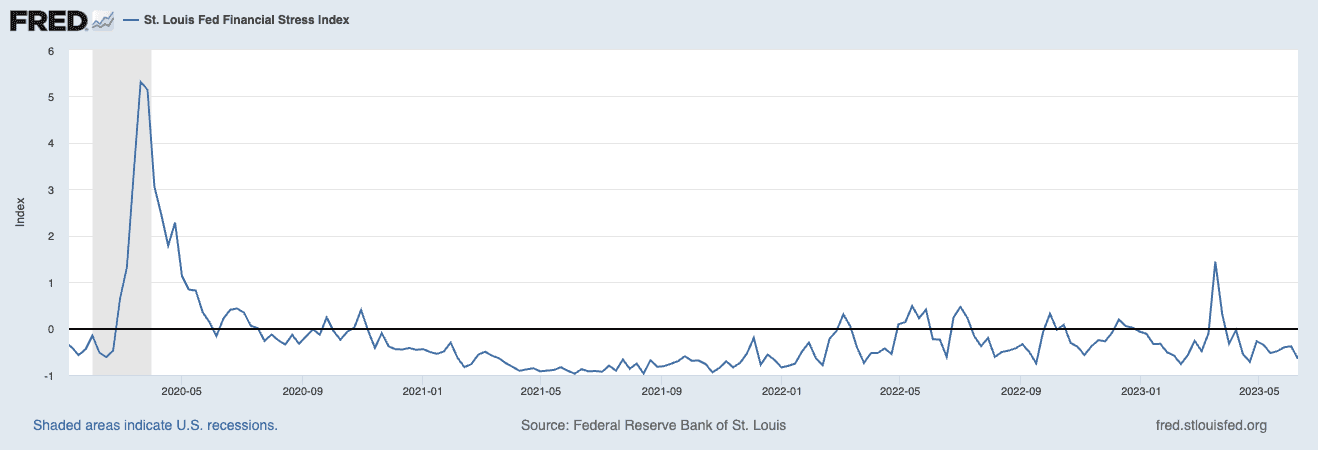
Volatility across markets continues to fall, with the VIX Index reaching three year lows exiting May. It has remained roughly at these levels June MTD. Volatility is well below the spike in March around bank solvency concerns, consistent with real time readings from the St. Louis Fed Financial Stress Index (below). This drop in volatility has coincided with an apparent stabilization in risk appetite; treasury yields remain flat from mid-march, while equity markets are now up double digits.
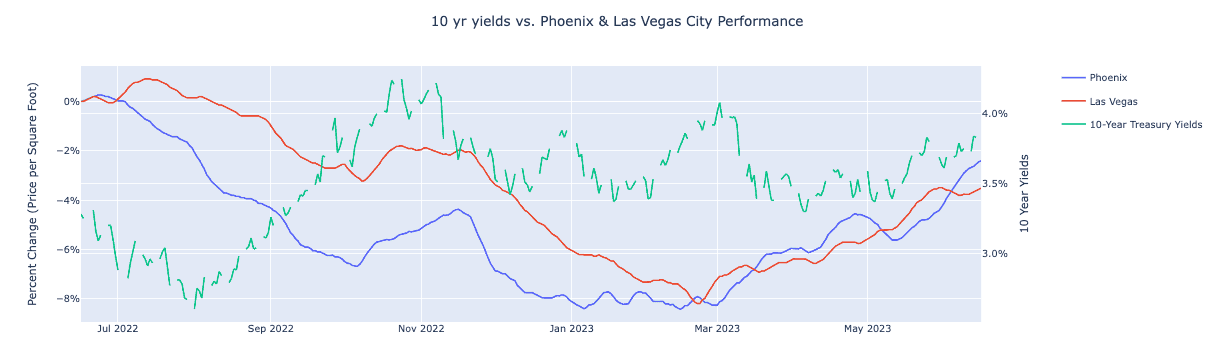
On the other hand treasury yields continue to exhibit elevated realized volatility, which has an impact on myriad downstream elements, such as mortgage rates and demand for housing. Phoenix and Las Vegas are two regional US real estate markets that exhibit among the highest negative correlations to real time changes in interest rates.
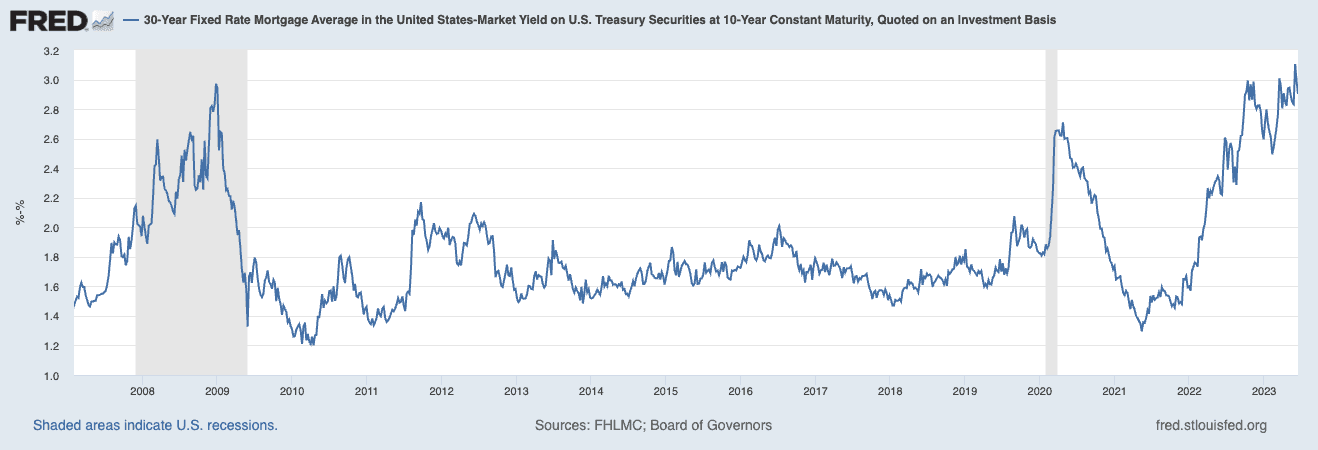
The spread between 30 year mortgage rates and the 10 year U.S. Treasury yield is the widest it has been in nearly 40 years. Should this spread mean revert somewhat, and the 10y Treasury remains unchanged or continues to decline, this could perhaps create an additional tailwind for residential real estate demand near term. Important to note, the magnitude is diminished when adjusting for the effects of duration relative to the treasury yield curve.
The Case Shiller updated with March data on Tuesday 5/30, showing a continued broad recovery in prices across most markets. Real time data from Parcl Labs picked this up as it was happening, and, in the nearly two months since, show a strong recovery, with many markets up low/mid single digit percent from their end-March marks. The Case Shiller is expected to update with April data on Tuesday 6/27.
Parcl Team


